Tariffs and Trade Wars: Supply Chain Effects
U.S. actions under Section 301 and Section 232 have significantly altered sourcing and factory locations. From 2018 to 2025, companies have reevaluated costs and risks due to global trade impacts. Boards must now quantify the effects of trade policies on pricing, lead times, and working capital.
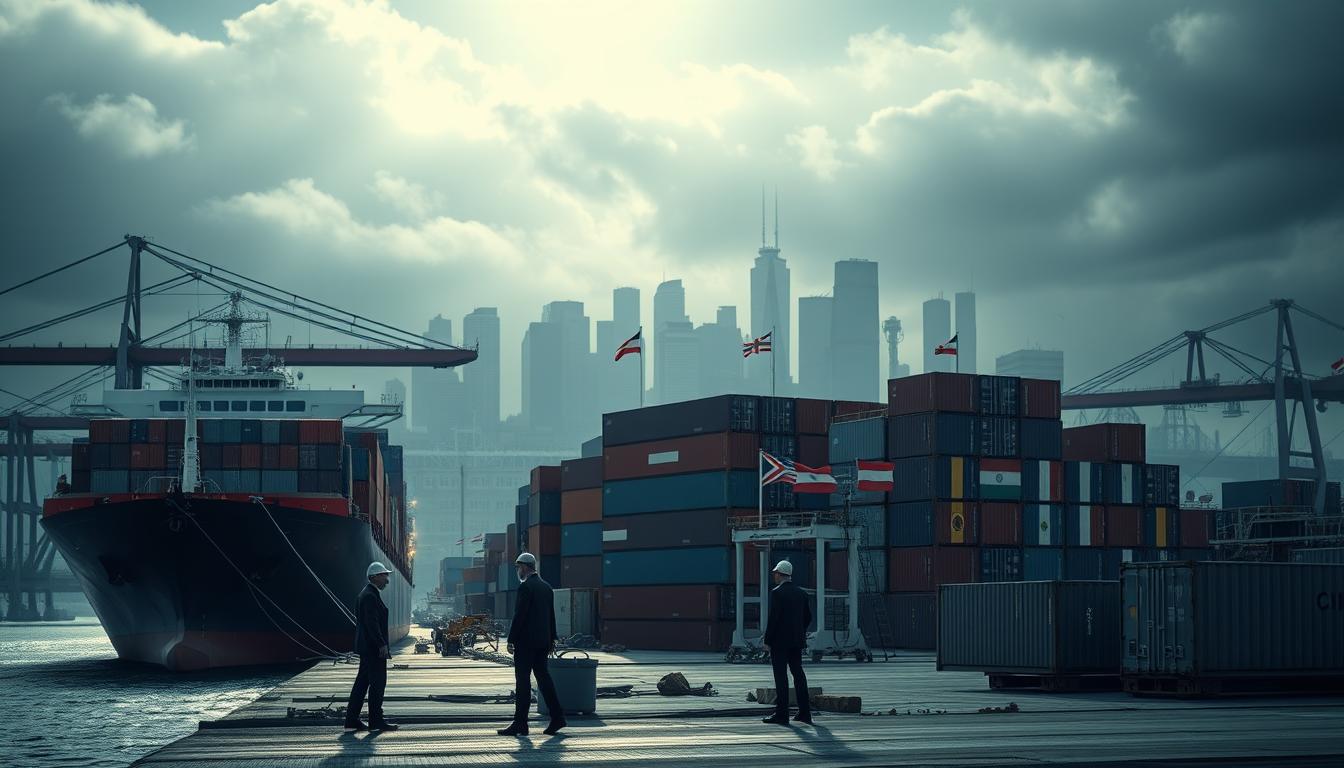
A tariff tool shows U.S. tariffs on China and India are around 41% and 36%, respectively. Vietnam, Thailand, and Malaysia have tariffs of 18%, 16%, and 11%. Countries like Morocco and Costa Rica offer tariffs of 10–15%. This has led to a shift towards Vietnam, Mexico, India, Thailand, and Malaysia for lower duties and tighter compliance.
Flat World Global Solutions reports on the volatility and disruptions caused by tariffs. Companies are rerouting to avoid double tariffs and are exploring Mexico under USMCA. This shift emphasizes the need for supply chain resilience, with finance and procurement preparing for various scenarios.
Historical disputes, such as the U.S.–China trade war and EU–U.S. steel tariffs, have set precedents. Tariffs, quotas, and export controls have increased costs and altered supply chain designs. This article examines the impact of tariffs and trade wars on supply chains, highlighting the effects on routing, capacity, and resilience.
Overview of Trade Policies Effects on Global Supply Chains
Trade rules significantly influence sourcing, routing, and costing across different regions. Companies closely monitor trade policies effects to understand tariff implications, trade war consequences, and the global trade impact on margins and lead times. The focus is on practical changes that affect the invoice, the route, and the factory gate cost.
Defining tariffs, sanctions, and non-tariff barriers
Tariffs, or import duties, increase the landed cost of goods. They affect price quotes, supplier choice, and working capital. These tariff implications directly influence purchase orders and contracts.
Sanctions and export controls limit access to certain countries, firms, or technologies. Non-tariff barriers include quotas, rules of origin, and ICTS-style limits on content from targeted economies. These tools compound the trade policies effects, expanding the global trade impact beyond just headline rates.
How trade wars escalate and reshape trade routes
Escalation often occurs through reciprocal duties and sector actions. For example, the U.S.–China measures launched in 2018, U.S.–EU steel and aluminum actions under Section 232, and Japan’s 2019 curbs on key semiconductor materials to South Korea. These actions have clear trade war consequences felt across ports and carriers.
Routes adjust toward tariff-favored hubs in ASEAN and North America, with tighter scrutiny on transshipment and rules-of-origin claims. Shippers re-time sailings and redirect to alternate entry points as tariff implications change week to week, amplifying the global trade impact on freight flows.
Why landed cost drives manufacturing location decisions
Landed cost combines production, freight, insurance, and customs duties. A 25% duty on select Chinese goods in 2018 lifted unit costs, pushing labor-intensive categories toward Vietnam, Mexico, and Bangladesh. Where differentials widen—such as China’s higher trade-weighted rates versus Vietnam’s lower levels—firms reallocate capacity if capex and supplier co-location allow.
When products fall outside Section 301 scope, rate gaps narrow to roughly 10 percentage points. In those cases, trade policies effects are muted, and the global trade impact depends more on scale, clusters, and certification. The net result: tariff implications become one variable in a model that also weighs quality, yield, and logistics risk.
- Key drivers: duty rates, freight volatility, rules of origin, and compliance costs
- Operational levers: multi-sourcing, bonded facilities, and origin engineering
- Risk markers: sudden tariff filings, licensing changes, and enforcement surges
Tariffs and Trade Wars Impact on Supply Chains
Tariffs are fundamentally changing how companies manage their procurement and logistics. The effects are seen in pricing, working capital, and network design. This drives a need for supply chain optimization across all nodes. Companies now face volatility, with disruptions tied to policy changes as much as capacity issues.
Cost pass-through, margin compression, and inflation risks
Increased U.S. tariff coverage raises landed costs, limiting the ability to pass on prices to customers. When only partial pass-through is possible, margins shrink, and capital budgets decrease. This situation increases inflation risk, as companies like Foxconn and Maersk face pricing pressures.
Procurement teams are now splitting SKUs based on elasticity to manage price changes. They also aim to reduce nonessential spending. Yet, the tight unit economics push companies to explore dual bills of materials and negotiate currency clauses with suppliers.
Forecast accuracy disruptions and inventory planning challenges
Tariff changes disrupt demand signals, leading to re-timed shipments and order cancellations. This weakens forecast accuracy. Logistics providers, such as UPS and FedEx, have seen softer purchasing activity and fluctuating rates.
Planners rely on real-time data to adjust safety stocks and reorder points. They increase cycle counts, remove slow-moving items, and adjust allocation rules by region. This helps contain disruptions while maintaining service levels.
Shifts from just-in-time to flexible, resilient models
Just-in-time models rely on stable lead times and predictable costs. With policy volatility, companies are moving to more flexible models. They are exploring multi-sourcing, maintaining critical buffer inventories, and using alternate port routings.
This shift requires a disciplined approach to supply chain optimization. Companies are codifying supplier tiers, expanding vendor-managed inventory, and using scenario analysis. This balances cash, risk, and service levels.
| Pressure Point | Operational Effect | Quantifiable Signal | Responsive Action |
|---|---|---|---|
| Tariff coverage expansion | Higher landed cost; margin squeeze | COGS up 2–5% on targeted SKUs | Price segmentation; dual BOMs; hedging clauses |
| Policy timing whipsaws | Order delays; rate volatility | Spike in cancellations and re-timed ETAs | Flexible booking windows; diversified forwarders |
| Forecast signal noise | Safety stock misalignment | MAPE deterioration across categories | Granular demand sensing; weekly S&OP recalibration |
| Freight market softening | Spot-rate swings; lane imbalances | Lower contract-to-spot spread | Mini-bids; multi-lane awards; port diversification |
| Capital constraints | Slower footprint shifts | Deferred capex and longer payback thresholds | Asset-light capacity, 3PL partnerships, phased investments |
Lessons from Recent U.S.-China and Section 301/232 Actions
The introduction of Section 301 tariffs in 2017-2018 significantly altered global trade dynamics. It led to a reevaluation of sourcing strategies and heightened compliance standards. Companies adjusted their landed cost models to factor in tariff impacts and logistics risks. The trade war’s effects were felt differently across various sectors, influenced by complexity, capital requirements, and supplier networks.
Declines in U.S. imports from China after 2017 Section 301 tariffs
Following the Section 301 tariffs, the U.S. saw a decline in imports from China, mainly in labor-intensive sectors. Furniture and home goods, in particular, experienced a significant shift towards Vietnam and Mexico. This change was not solely due to transshipment but also reflected genuine shifts in supply chains, driven by new investments and capacity expansions.
Bangladesh emerged as a beneficiary in the apparel sector, attracting basic apparel production due to lower duties and more predictable lead times. This shift highlights the trade war’s impact on sectors with low capital requirements and simple tooling needs.
Where high-capex, complex sectors stayed in China despite 25% tariffs
Despite the 25% tariffs, high-capital and complex sectors remained in China. The introduction of Section 232 tariffs further complicated the situation by adding to the metals-related costs. High margins and specialized processes helped mitigate the tariff impact, slowing down relocation plans.
Manufacturers considered various factors, including depreciation, yield improvements, and tooling certification, when deciding on tariff costs. The scale requirements and certification timelines in some sectors discouraged rapid shifts away from China.
Electronics clusters and supplier co-location advantages
Shenzhen, Guangzhou, and Suzhou emerged as key electronics hubs in China. These areas boasted a concentration of component fabs, specialized tooling, EMS providers like Foxconn and Pegatron, and robust logistics networks. This co-location significantly reduced cycle times and minimized the need for working capital, mitigating the effects of Section 301 tariffs.
China’s dominance in LED lamps and modules was sustained by its scale economies and mature ecosystem. Despite the diversification efforts of some companies, Section 232 tariffs and related regulations posed challenges. The global trade impact in advanced segments was, to some extent, cushioned by the advantages of these clusters and the availability of skilled labor.
Geography of Diversification: ASEAN, USMCA, and Beyond
Corporate sourcing maps are evolving as companies seek supply chain resilience post-trade tensions. Tariff gaps now favor ASEAN supply chains, boosting regional production under USMCA. Capital is flowing to places where compliance, logistics, and unit economics are favorable.
ASEAN acceleration: Vietnam, Thailand, and Malaysia as winners
Tariff differentials have widened, from 7 points in January 2025 to 24–30 points by mid-September. China’s tariffs stand at 41%, while Vietnam, Thailand, and Malaysia have tariffs of 18%, 16%, and 11%, respectively. This disparity supports ASEAN supply chains and enhances landed costs.
Vietnam is expanding in consumer electronics, furniture, footwear, and household appliances. Thailand is focusing on lower-complexity electronics like printers, copiers, PCBs, and switches or routers. Malaysia is deepening its semiconductor assembly, testing, and packaging capabilities, adding selected components to boost supply chain resilience.
USMCA dynamics: high compliance rates and carveouts for autos
Under USMCA, duty-free entry remains high, with 77% for U.S. imports from Mexico and 89% from Canada in July. This sustains integrated North American production. Autos and parts benefit from carveouts, with tariffs applied only to non-U.S. content of imported vehicles and none on parts.
New 232 actions narrow Mexico’s edge against EU and Japan autos at 15%, and fentanyl-related tariffs heighten the value of strict rules-of-origin compliance. This results in more rigorous documentation and audit readiness across cross-border lanes.
Emerging hubs in India, Latin America, and Africa
India is gaining momentum if reciprocal tariffs fall and duties tied to Russian oil ease. Dell, HP, Lenovo, Foxconn, and Pegatron have aligned investments with Make in India incentives, adding options for supply chain resilience in selected electronics.
Selective FDI flows to Morocco, Egypt, and Turkey in textiles, and to Ethiopia, Kenya, Guatemala, Honduras, and El Salvador in apparel. These hubs offer cost advantages but face limits in workforce depth, infrastructure, and policy stability. There is also added uncertainty from possible punitive measures in the trade tensions aftermath.
| Region | Tariff/Policy Position | Primary Specializations | Key Advantages | Operational Constraints |
|---|---|---|---|---|
| Vietnam | Trade-weighted ~18% | Consumer electronics, furniture, footwear, appliances | Competitive tariffs, growing vendor base | Capacity tightness during peak seasons |
| Thailand | Trade-weighted ~16% | Printers, copiers, PCBs, switches/routers | Proven electronics clusters | Lead-time variability for components |
| Malaysia | Trade-weighted ~11% | Semiconductor assembly, testing, packaging; components | Skilled AT&P workforce, stable policy | Land and utility cost pressures |
| Mexico (USMCA) | High duty-free share; autos carveouts | Autos, parts, electronics assembly | Proximity to U.S., rules-of-origin benefits | 232 exposure narrowing auto advantage |
| Canada (USMCA) | High duty-free share | Autos, machinery, energy-linked goods | Integrated North American supply base | Compliance costs under new scrutiny |
| India | Improving with incentives; pending tariff shifts | Electronics assembly by global brands | Large market, policy incentives | Logistics bottlenecks, customs variability |
| Latin America & Africa | Selective incentives; tariff risks vary | Textiles and apparel clusters | Labor cost advantages, near-shoring options | Infrastructure gaps, policy stability risks |
Across these corridors, firms adjust their footprints to convert tariff spreads into margin protection and to harden networks against future shocks. The combination of ASEAN supply chains and USMCA pathways offers diversified buffers in the trade tensions aftermath. This preserves speed-to-market and compliance discipline.
Tariff Differentials and Their Strategic Implications
Rate gaps are transforming network designs. The U.S. tariffs on China are near 41%, India around 36%, and Vietnam about 18%. Thailand and Malaysia have tariffs of 16% and 11%, respectively. Morocco and Costa Rica are close to 10–15%. These numbers are key for planning routes, choosing suppliers, and allocating capital.
Product-specific tariffs also vary. For example, tariffs on video game consoles and ceramic kitchenware differ by about 10 percentage points between China and Vietnam. The 2024 Section 301 additions in batteries widened the gap by about 40 percentage points. These changes affect trade policies and make-versus-buy decisions across various product categories.
When capital needs are moderate and suppliers can be replicated, shifts happen faster. Sectors linked to China’s Shenzhen and Yangtze River Delta are slower due to their large ecosystems. Companies focus on optimizing supply chains by transitioning gradually, qualifying suppliers in stages, and implementing tooling in phases.
Mexico presents a unique opportunity. USMCA exemptions can offset duties in many products, making North America-bound goods more cost-effective. Yet, new Section 232 actions in furniture and medical supplies complicate export models, adding uncertainty to global trade and facility locations.
Leading companies model landed costs with precise inputs. They consider rules-of-origin, duties, transshipment penalties, freight volatility, and currency changes. Scenario trees help evaluate duty exposure, service levels, and lead times. Countries with stable policies, reliable infrastructure, and strong FDI incentives are preferred in risk-adjusted plans.
In practice, this ranking shapes sourcing strategies. Vietnam, Thailand, and Malaysia are favored for batteries, appliances, and some consumer electronics when tooling costs are low. Complex assemblies with deep sub-tier reliance often stay in China until component density can be replicated without compromising quality or reliability.
The key takeaway is disciplined evaluation. Teams align engineering changes with customs planning, secure origin documentation, and validate value-add percentages before scaling up. This approach balances tariff implications with trade policies, sustaining supply chain optimization and reducing adverse global trade impact.
Sector Spotlights: Electronics, Furniture, Apparel, and Components
Regional shifts in the market reflect the impact of tariff changes and policy adjustments. Companies are focusing on optimizing their supply chains to manage costs, capacity, and compliance. The ongoing trade tensions are reshaping the way goods are routed, sourced, and assembled, highlighting the significant impact on supply chains.
Consumer electronics growth in Vietnam; printers and PCBs in Thailand
Vietnam is becoming a key player in the U.S. consumer electronics market, with major players like Foxconn, Pegatron, and Samsung Electronics expanding their operations. This growth is driven by the need for faster and more reliable production, leading to improved yields and shorter lead times. The establishment of co-located suppliers is a key factor in this optimization.
Thailand is leading the way in U.S. imports of printers, copiers, and fax machines. It is also increasing its capacity for printed circuit boards. Several products are now shipped from Thailand at 0% U.S. tariffs, compared to 27.5–45% from China. This shift is prompting the relocation of printers, switches, and routers, illustrating the impact of trade tensions on supply chains.
Semiconductor ATP and components specialization in Malaysia
Malaysia is strengthening its position in the semiconductor industry, with companies like Intel, Infineon, and ASE operating advanced assembly, test, and packaging (ATP) nodes. The country’s focus on niche components, such as sensors and power modules, is supported by mature supplier parks in Penang and Kulim. The widening tariff differentials in 2024, including a significant gap in rubber surgical gloves, are boosting Malaysia’s export competitiveness.
Furniture shifts from China to Vietnam amid new 232 considerations
The furniture industry has shifted from China to Vietnam following the 2018 Section 301 tariff increase to 25%. Vietnam’s stable input sourcing and competitive labor costs have made it a top supplier. The recent Section 232 considerations on furniture categories may alter the competitive landscape, but anti-dumping and countervailing duties on Chinese upholstered wooden chairs remain high, maintaining Vietnam’s pricing advantage.
Procurement teams are modeling landed costs, including duties, freight, and compliance audits. Vietnam faces around a 20% reciprocal tariff in some categories, creating a significant pricing gap. These dynamics are driving supply chain optimization and highlighting the ongoing impact of trade tensions on supply chains.
Apparel and footwear opportunities across India and select EMs
The apparel and footwear industry is diversifying its sourcing to India, Vietnam, Bangladesh, and select African and Latin American economies. India’s growth is influenced by tariff talks and energy-related duty adjustments. OEM commitments from Dell, HP, Lenovo, Foxconn, and Pegatron are building a deeper ecosystem for accessories and packaging inputs.
Brands are refining their origin mixes to manage wage trends, utility reliability, and compliance costs. By diversifying their sourcing, they are reducing their exposure to single-point risks. This strategy is advancing supply chain optimization and reflecting the ongoing impact of trade tensions on consumer goods.
| Product/Segment | Primary Emerging Hub | Competitive Edge | Indicative Tariff Differential | Implication for U.S. Buyers |
|---|---|---|---|---|
| Consumer Electronics (Final Assembly) | Vietnam | Scale assembly lines; integrated EMS networks | Lower vs. China on select SKUs; stable MFN rates | Shorter lead times; resilient sourcing mix |
| Printers, Copiers, Routers, PCBs | Thailand | 0% U.S. tariffs for several HS codes; skilled labor | 0% Thailand vs. 27.5–45% China (category dependent) | Improved margins; accelerated relocation |
| Semiconductor ATP and Niche Components | Malaysia | Mature ATP clusters; quality yields | Example: gloves ~19% Malaysia vs. ~80% China | Cost-effective component sourcing |
| Furniture (Upholstered, Wooden) | Vietnam | Established workshops; reliable inputs | China ~25%+ 301 and ~55% AD/CVD vs. Vietnam lower effective rates | Pricing spread supports Vietnam placement |
| Apparel and Footwear | India; Vietnam; Bangladesh; select Africa/LatAm | Diversified supplier base; scaling compliance | Dependent on bilateral deals and MFN schedules | Portfolio approach to cost and risk |
Supply Chain Resilience and Optimization Under Trade Tensions
Enterprises are reconfiguring their networks to manage the effects of trade wars. They aim to preserve cash flow and maintain service levels. The goal is to enhance landed cost, lead time, and compliance exposure without sacrificing scale.
Nearshoring, friendshoring, and multi-sourcing playbooks
Manufacturers are adopting nearshoring to Mexico and Canada under USMCA to reduce border frictions. Friendshoring is expanding to the European Union and Japan, with South Korea as a new frontier. Here, tariffs near 15%, with carveouts for generic pharmaceuticals and aircraft parts.
Multi-sourcing across ASEAN hubs—Vietnam, Thailand, and Malaysia—is becoming a cornerstone. It anchors capacity at roughly 19–20% tariff environments. This approach reduces single-country risk and advances optimization by aligning product families with cluster advantages and trusted customs regimes.
Data-driven planning to counter demand forecasting volatility
Tariff whipsaws have increased forecast error and inventory swings. Operations teams use granular analytics and scenario trees to stabilize inventory. They pause or re-time purchase orders and model reorder points and safety buffers by policy horizon.
Machine learning signals, SKU-level elasticity, and port dwell metrics inform weekly revisions. These steps enhance supply chain resilience and compress cash-to-cash cycles, limiting global trade impact from policy shocks.
Rerouting, transshipment risks, and rules-of-origin compliance
Routing strategies now include importing into alternate markets to avoid double tariffs and staging distribution remotely. Enforcement is tighter: U.S. authorities flag transshipment through low-tariff hubs like Singapore, with penalties up to 40% for misdeclared country-of-origin.
Companies assess phased content localization versus immediate thresholds as diversified networks rely on Chinese intermediates. Clear rules-of-origin mapping, supplier affidavits, and digital traceability protect against trade war consequences while sustaining supply chain optimization at scale.
| Strategy | Core Objective | Tariff/Policy Context | Operational Tactics | Risk Controls |
|---|---|---|---|---|
| Nearshoring (USMCA) | Shorten lead times and cut border friction | Stable USMCA rules; high compliance rates | Shift final assembly to Mexico/Canada; align with automotive carveouts | ROO audits; localized BOM tracking; bonded inventory |
| Friendshoring (EU, Japan, South Korea) | Diversify allied supply nodes | ~15% average tariffs; carveouts for pharma and aircraft parts | Source inputs from certified partners; leverage AEO programs | Supplier declarations; invoice-level origin validation |
| ASEAN Multi-sourcing | Reduce single-country exposure | ~19–20% tariff environments across Vietnam, Thailand, Malaysia | Split volumes; cluster by components, ATP, and PCBs | Dual tooling; customs pre-clearance; freight visibility |
| Data-Driven Planning | Stabilize demand and inventory | Tariff whipsaws and policy shocks | Weekly S&OP; ML forecasts; dynamic safety stock | Exception dashboards; forecast bias controls; PO re-timing |
| Compliance & Routing | Protect margin and avoid penalties | Tighter transshipment enforcement; 40% penalties risk | Direct import to alternate markets; remote staging | Digital traceability; ROO mapping; broker SOPs |
These strategies balance cost-to-serve with policy exposure. The result is measurable supply chain resilience, credible optimization, and reduced global trade impact amid evolving trade war consequences.
Company Responses on the Ground
Manufacturers and retailers are swiftly adapting to changing prices. They monitor tariff notices by product, lane, and origin to minimize risks. The aim is to mitigate supply chain disruptions while assessing the impact of trade policies on costs, lead times, and cash flow.
Procurement, logistics, and finance teams work together daily. They manage inventories and aim to preserve profit margins. Many companies use SKU-level cost models to forecast the impact of tariffs and trade wars on their supply chains. Operations teams also evaluate the effects of trade tensions on routing and port choices.
Pausing/canceling POs and re-timing shipments amid tariff whipsaws
Following the April tariff signals, companies paused or canceled purchase orders to avoid overpaying. Several rescheduled sailings and lifted shipments earlier to beat rate resets. This strategy trimmed inventory risk and delayed nonessential buys until pricing became clearer.
Brands like Apple suppliers, Walmart vendors, and medical device producers adjusted their PO calendars to match demand bands. These adjustments limited write-downs and softened exposure to supply chain disruptions during the trade tensions aftermath.
Redirecting imports to alternate ports/markets to avoid double tariffs
To prevent compounding duties on goods transiting the United States before re-export, some importers routed direct to Canada or other end markets. Auto parts, apparel, and furniture importers used alternative ports and free trade zones to minimize cascading costs.
This redirection required strict rules-of-origin checks and real-time visibility on port congestion. The approach balanced trade policies effects with customer service levels and preserved lane reliability under Tariffs and Trade Wars Impact on Supply Chains.
Building optionality: Mexico manufacturing, with exposure to new 232s
Companies that invested in Mexico gained nearshoring agility, faster truck transit, and closer collaboration with U.S. buyers. Electronics assemblers, furniture makers, and medical suppliers diversified inputs away from China while scaling in Nuevo León, Jalisco, and Coahuila.
Yet exposure rose as new Section 232 actions reached categories Mexico exports to the U.S. Firms added dual tooling, flexible bills of materials, and contingency lanes to counter fresh risks and avoid renewed supply chain disruptions during the trade tensions aftermath.
| Action | Primary Objective | Operational Tactics | Measured Result | Risk Trade-off |
|---|---|---|---|---|
| Pause/Cancel POs; Re-time Shipments | Protect margin amid tariff swings | Shift ETDs/ETAs; defer noncritical SKUs; dynamic safety stock | Lower holding costs; reduced write-downs | Stockouts if demand rebounds faster than expected |
| Redirect Imports to Alternate Ports/Markets | Avoid double tariffs and re-export penalties | Direct-to-Canada routings; FTZ usage; origin audits | Improved landed cost; fewer duty layers | Complex compliance and routing variability |
| Build Mexico Manufacturing Optionality | Reduce China reliance; shorten lead times | Dual sourcing; nearshore assembly; cross-border trucking | Faster cycle times; better service levels | Exposure to new 232 actions and quota shifts |
| Deepen Supplier Partnerships | Stabilize supply under volatility | Vendor-managed inventory; long-term agreements | Higher fill rates; predictable capacity | Reduced flexibility if policy shocks intensify |
| Technology and Compliance Monitoring | Real-time visibility on duties and routing | Tariff engines; rules-of-origin checks; lane analytics | Fewer compliance errors; optimized routing | Tooling costs and data integration complexity |
Across sectors, lower purchasing activity pushed freight rates down and forced logistics providers to keep service steady under fluctuating volumes. Teams maintain scenario plans that reflect trade policies effects and quantify the Tariffs and Trade Wars Impact on Supply Chains through working capital, service level, and total landed cost lenses.
Policy Uncertainty and What to Watch Next
Executives are navigating a complex landscape of tariffs, legal authority, and compliance timelines. The agenda for the near term will significantly influence tariff implications, trade war consequences, and the broader global trade impact for 2025 planning.

Developing baseline models should account for legal shifts, new enforcement tools, and evolving rules of origin. Teams responsible for procurement, finance, and logistics must create plans based on specific policy markers, not just calendar dates.
IEEPA legal risk and possible shifts to Section 122/338 or ICTS tools
Many tariffs rely on emergency powers under the International Emergency Economic Powers Act. If the Supreme Court narrows IEEPA, as some predict, about 30 percentage points of China tariffs could be at risk. This would reduce tariff implications, narrow price gaps, and alter trade war consequences for sourcing strategies.
Policymakers might turn to Section 122 safeguards, Section 338 retaliatory duties, an expanded Section 301 scope, or Information and Communications Technology and Services restrictions. Each option has distinct effects on coverage, timing, and litigation risk, impacting landed cost and cash flow globally.
Transshipment tariffs and tighter rules of origin on Chinese content
Attention is now on origin integrity. The administration has proposed a 40% transshipment tariff for improper routing and hinted at stricter rules of origin to limit non-market economy content. These moves increase tariff implications for third-country processing and raise documentation burdens.
Auditable bills of materials, supplier affidavits, and digital traceability are now critical. Compliance costs will rise, shipments may be delayed, and the global trade impact will intensify where assembly hubs rely on Chinese inputs.
Global tightening on Chinese overcapacity and retaliation dynamics
The European Union, Mexico, Canada, Brazil, and India are imposing tighter tariffs and non-tariff measures against Chinese overcapacity. This opens up new markets for production outside of China but also invites countermeasures like export controls on critical inputs.
Companies should assess their exposure to materials and components that could face licensing or quotas. The tariff implications and trade war consequences extend beyond bilateral trade, affecting autos, batteries, solar, and steel globally.
Macro variables: U.S.-China negotiations, core inflation, and Supreme Court outcomes
Negotiations between Washington and Beijing, including leverage tied to fentanyl actions, may alter timelines. U.S. core inflation sets a political ceiling for new costs, moderating near-term moves.
Supreme Court rulings on emergency powers will determine the longevity of current measures. China’s deflation, weaker currency, and post-2020 capacity allow competitive exports even with a 30-point disadvantage in some sectors, influencing trade policies effects and the global trade impact for relocation versus stay-put strategies.
- Action focus: build legal contingency maps for IEEPA risk and alternatives.
- Compliance focus: strengthen origin audits to mitigate transshipment exposure.
- Supply focus: secure critical inputs vulnerable to Chinese countermeasures.
- Macro focus: tie sourcing triggers to inflation prints and court outcomes.
Conclusion
Tariff architectures are fundamentally altering production landscapes. The U.S. imposes trade-weighted tariffs near 41% on China, a stark contrast to the low-to-mid teens on favored partners. This disparity is driving the relocation of goods production. Labor-intensive and low-capital sectors are gravitating towards ASEAN and USMCA regions. In contrast, China’s capital-intensive ecosystems, despite facing 25%+ duties, remain a stronghold.
This shift is at the heart of the Tariffs and Trade Wars Impact on Supply Chains and the broader trade policies effects. Companies are now focusing on building supply chain resilience through nearshoring, friendshoring, and multi-sourcing. By leveraging data-driven planning, they aim to reduce forecast errors and minimize safety stock waste. Routing and documentation controls are also in place to circumvent double tariffs, transshipment risks, and rules-of-origin breaches.
These strategies are critical in the trade tensions aftermath, where compliance and landed cost discipline are key to maintaining margins. Policy risk continues to be a decisive factor. The introduction of IEEPA limits, expanded Section 301 and 232 use, new Section 122 or 338 actions, and ICTS-style rules could significantly alter tariff differentials and audit exposure. Tighter rules of origin, coupled with global responses to Chinese overcapacity and China’s countermeasures, will redefine accessible markets for ex-China production.
Scenario testing, tied to each product’s landed cost and legal pathway, has become a standard practice. What emerges as effective is precise execution. Companies should model total landed cost by SKU and lane, run policy scenarios, and enforce documentation rigor at every node. Maintaining optionality across ASEAN, Mexico, and the United States, while monitoring capacity, lead times, and port performance, is essential. This operating model best protects cash flow and service levels, sustaining supply chain resilience amidst ongoing trade policies effects and the evolving Tariffs and Trade Wars Impact on Supply Chains in the trade tensions aftermath.
FAQ
How do tariffs, sanctions, and non-tariff barriers change supply chain costs and routes?
Tariffs increase the cost of imports by adding duties to various expenses. This affects pricing and profit margins. Sanctions and export controls block access to certain firms, technologies, or countries. Non-tariff barriers, like quotas and rules of origin, limit the use of specific economies’ content.
These measures lead to sourcing in lower-tariff regions. They also cause rerouting to different ports and increase scrutiny of transshipment. This reshapes trade lanes and lead times.
What evidence shows trade wars are diversifying sourcing away from China?
From 2018 to 2025, U.S. tariffs under Section 301 and Section 232 pushed sourcing to Vietnam, Mexico, India, Thailand, and Malaysia. A tariff tool shows U.S. tariff rates for China are near 41%, while rates for Vietnam, Thailand, and Malaysia are 18%, 16%, and 11%, respectively. U.S. import shares fell in labor-intensive goods like furniture and apparel.
ASEAN and USMCA capacity grew through FDI and supplier build-outs. This shift reflects a re-optimization of landed costs.
Where do tariff differentials most influence relocation decisions?
Moves are faster in low-capex, labor-intensive categories with replicable supplier networks. Examples include furniture, apparel, small appliances, and some electronics assembly. In sectors with wide tariff gaps, like batteries, production shifts to ASEAN.
For complex, high-capex segments with deep co-location, like LED modules and advanced electronics, China’s clusters and scale keep production despite high duties.
How are companies building supply chain resilience under ongoing trade tensions?
Enterprises use multi-sourcing, nearshoring under USMCA, and friendshoring with partners like Japan and the EU. They employ data-driven planning to manage forecast volatility. This includes using buffer inventory and reconfiguring routes to avoid double tariffs.
Compliance programs focus on rules of origin and transshipment. Monitoring is done for anti-dumping, countervailing duties, and “transshipment tariffs.”
What are the main operational impacts reported by logistics providers?
Logistics providers report tariff-induced forecast volatility, paused or canceled orders, and rescheduled shipments. They reroute cargo to avoid double tariffs and add Mexico manufacturing for optionality. Purchasing activity and transportation rates have softened.
Operators face fluctuating costs and increased documentation demands for compliance.
How do Section 301 and Section 232 measures affect sector strategies?
Section 301 tariffs on Chinese goods shifted production to Vietnam, Thailand, and Mexico in mass-market furniture, footwear, and basic electronics. Section 232 actions increased compliance complexity in metals and may expand to sectors like furniture and medical supplies. This changes the relative advantages for Mexico and ASEAN.
Autos and parts benefit from USMCA carveouts, though new 232s have narrowed Mexico’s edge against EU and Japanese autos.
What risks could alter today’s tariff landscape and diversification pace?
A Supreme Court limit on IEEPA could risk a large share of China tariffs, narrowing differentials and slowing diversification. Policymakers might pivot to Section 122, Section 338, expand Section 301 scope, or use ICTS restrictions. The U.S. signals tighter rules of origin and possible 40% penalties for improper transshipment.
Global tightening in response to Chinese overcapacity—and China’s countermeasures—adds uncertainty for supply chain optimization and investment timing.