Efficient Value Stream Mapping Step-by-Step Guide
Value Stream Mapping (VSM) reveals the journey from idea to customer outcome. It visualizes the flow of people, processes, information, and inventory. This allows teams to identify delays and waste, setting a clear path for improvement.
Born in the Toyota Production System, VSM focuses on quality and speed by addressing issues at their source. It is a cornerstone of Lean manufacturing and Lean Six Sigma, aiming for seamless end-to-end flow. PwC highlights that most business activities lack value, often 80–90 percent, making a detailed VSM tutorial vital for leaders facing cost and service pressures.
In sectors like manufacturing, healthcare, technology, and finance, VSM yields significant benefits. A rope producer, for instance, streamlined material flow, reducing handling time by 33 percent. IT services saw improved collaboration and fewer handoffs through leadership workshops. Teams often begin with whiteboards and sticky notes before transitioning to software like Lucidchart or Edraw for standardized symbols and consistent data.
This guide outlines how to measure processing, wait, cycle times, and inventory, then calculate process cycle efficiency. It connects the map to customer value, Agile delivery, and Continuous Improvement. The aim is to implement these changes effectively: align sales and operations, shorten lead times, boost throughput, and maintain results with a data-driven VSM process guide.
Readers will receive a concise VSM tutorial with clear objectives, roles, and metrics. The approach supports incremental change, rapid feedback, and reliable measurement. Use this step-by-step guide to design a future state that eliminates waste while preserving quality and service.
What Is Value Stream Mapping and Why It Matters in Lean Manufacturing
Value Stream Mapping (VSM) illuminates the journey from idea to customer delivery. It serves as a guide, illustrating the flow of work, decisions, and materials in one view. Teams use it to identify delays, excess inventory, and rework, aligning efforts with Lean manufacturing and Continuous Improvement.
Defining the value stream from concept to customer
The value stream encompasses the entire journey from concept to customer. It includes design, sourcing, production, delivery, service, and returns. By mapping each stage, VSM quantifies lead, touch, and wait times, pinpointing areas for improvement.
How VSM visualizes people, processes, information, and inventory
VSM captures the dynamics of people, processes, information systems, and inventory. It uses data boxes, timelines, and queues to reveal capacity, cycle time, and constraints. By following a step-by-step approach, it offers a clear view of value-added activities, necessary steps, and waste, supporting Lean manufacturing.
Origins in the Toyota Production System and Lean Six Sigma
Developed in the Toyota Production System, VSM focuses on flow, quality at the source, and early defect detection. It became a key tool in Lean Six Sigma, aiding in problem definition and analysis. This heritage grounds the Continuous Improvement methodology in disciplined measurement and visual control.
Connecting VSM to culture change, collaboration, and continuous improvement
VSM fosters shared visibility across departments. It uncovers handoffs and mismatched priorities, facilitating cross-functional decisions. Organizations apply VSM with Agile practices like Scrum, Kanban, and SAFe to streamline releases and reduce queue times, advancing Lean manufacturing.
This approach fosters fact-based discussions and rapid learning cycles. Regular map reviews align goals, metrics, and governance with Continuous Improvement. As teams refine their Value Stream Mapping, they embed transparency and sustain momentum in throughput, lead time, and service-level enhancements.
Key Elements of a Value Stream Map and What They Reveal
A detailed map transforms operations into quantifiable data. Through a Value Stream Mapping tutorial, VSM tools, and techniques, we learn to capture timing, flow, and quality. This allows leaders to assess performance accurately. A VSM process guide ensures that data collection is consistent across teams.
Processing time, wait time, cycle time, and inventory levels
Processing time tracks the actual work done at each stage. Wait time measures the idle time between these stages. Cycle time is the total time from start to finish for a unit.
Inventory levels between stages show queues and cash tied up in work-in-progress. As any Value Stream Mapping tutorial will show, this data reveals flow stability and where lead time increases.
Quality metrics, resources used, space, and distance traveled
Monitor first-pass yield, defect rates, and rework counts to link quality to cost. Note the resources used, including people, tools, and machines, and their utilization.
Document the space consumed and distance traveled by materials or staff. VSM tools and techniques often include simple spaghetti diagrams to quantify motion and transport. This improves analysis in various settings.
Standard symbols and “language of Lean” for consistent mapping
Use the language of Lean for consistent maps: rectangles for steps, triangles for inventory, diamonds for decisions, and bursts for issues. Color coding can indicate status, like started, in progress, or complete.
Edraw and Lucidchart offer symbol libraries, while whiteboards maintain the same iconography. A VSM process guide ensures uniform notation in workshops and audits.
How data-rich maps expose bottlenecks and constraints
Queues, rework loops, and decision points highlight throughput limits. Mapping handoffs and ownership clarifies where tasks shift and where miscommunication causes delays.
Quantifying the impact on speed, quality, and cost helps rank constraints. With VSM tools and techniques and a practical Value Stream Mapping tutorial, teams can pinpoint the critical steps that dictate overall flow capacity.
Purpose and Benefits: Maximizing Customer Value and Reducing Waste
Value Stream Mapping helps identify which steps add value and which do not. It separates value-added work from unnecessary delays, rework, and excess movement. This process exposes the seven wastes: overproduction, waiting, transport, overprocessing, inventory, motion, and defects. It focuses teams on improving Value Stream Improvement, ensuring cost, speed, and quality are maintained.
This method enhances communication and alignment across different functions. It visualizes the entire process flow, making constraints and handoffs clear. Analysts use real-time data to guide Value Stream Improvement, setting measurable targets. These practices standardize evaluation and support disciplined changes, following Lean manufacturing steps.
The Toyota Production System’s success in improving speed and quality through managing flow is well-documented. PwC found that 80–90% of tasks in typical processes add no value, highlighting the significant room for improvement. Value Stream Mapping encourages continuous improvement and culture change based on evidence, not opinion.
Organizations have seen tangible benefits from rigorous mapping. A rope manufacturer reduced material handling time by 33% by redesigning flow and minimizing motion and transport. In IT services, leaders used cross-functional mapping to break down silos, clarify ownership, and standardize work. This reflects Lean manufacturing steps that reduce waiting and defects, increasing throughput and forecast accuracy.
- Customer value focus: Prioritize features, speed, and reliability that buyers recognize and pay for.
- Waste visibility: Quantify delays, rework, and excess inventory to target rapid Value Stream Improvement.
- Operational gains: Shorter lead times, higher throughput, and stronger sales–operations alignment.
- People and process: Clear roles, better collaboration, and sustained innovation via iterative refinement consistent with Value Stream Mapping best practices.
Value Stream Mapping Step-by-Step
This guide outlines a practical sequence for teams in various settings. It leverages Lean Six Sigma and Toyota Production System principles. It focuses on data, flow, and quality, ensuring each step is measurable and observable.
Identify the process, scope boundaries, and stakeholders
Start with a high-impact value stream aligned with customer demand. Define clear start and end points, such as from order receipt to shipment confirmation. Ensure all stakeholders, including operations, quality, finance, and IT, are involved for informed decisions and data access.
Map the current state with real data, not guesses
Utilize tools like whiteboards, sticky notes, or software from Lucidchart or Edraw with standard VSM symbols. Observe work and time actual steps on the floor. This is a hands-on activity, not just an interview summary.
Capture lead time, process time, WIP, and decision points
Record the time for each task and the wait time between them. Count work-in-progress at each queue. Mark decision nodes like quality checks or branching logic. Calculate process cycle efficiency by dividing value-added time by lead time.
Analyze delays, handoffs, and rework to find bottlenecks
Track every handoff, approval, and rework loop. Quantify their effects on speed, cost, and defect risk. Use this approach to compare cycle time versus takt time and identify capacity-wasting queues or rework.
Design a future state aligned to customer value and business goals
Apply Toyota’s principle of stopping at error and removing unnecessary steps. Sequence flow to reduce wait time and inventory while maintaining quality. Align changes with demand signals, lead-time targets, and service-level agreements.
Implement iteratively with milestones, owners, and metrics
Divide work into increments with defined owners and due dates. Track cycle time, throughput, first-pass yield, and WIP. Use a VSM process guide to stage pilots, evaluate results, and expand.
Sustain with feedback loops and Continuous Improvement methodology
Run regular retrospectives and gemba walks to validate gains. Maintain visual controls, update the map, and recalibrate metrics. Institutionalize Continuous Improvement methodology to reinforce the Value Stream Mapping tutorial with each iteration.
How VSM Supports Lean Thinking Across Industries
Value Stream Mapping (VSM) reveals the journey from request to delivery. It aligns sales, operations, and finance with customer value and flow metrics. It supports Lean manufacturing steps, guiding through design, build, and sustain phases. It also drives Value Stream Improvement and Continuous Improvement.
Technology, manufacturing, healthcare, and services sectors apply VSM to reduce delays and rework. It enhances predictability. It complements Agile practices like Scrum, Kanban, and SAFe by streamlining handoffs and resource allocation.
Classifying activities: value-added, necessary non-value-added, and waste
VSM identifies value-added steps as those changing the product or service for customer payment. Controls, scheduling, and compliance are necessary non-value-added. Waiting, extra motion, and rework are waste.
- Value-added: transforms the item to meet a customer need.
- Necessary non-value-added: required for safety, regulation, or coordination.
- Waste: activities that consume time or cost without improving the outcome.
By tagging each activity, teams link Lean manufacturing steps to targeted Value Stream Improvement. This shared taxonomy supports a Continuous Improvement methodology with clear priorities.
Applying VSM in manufacturing, healthcare, software, logistics, and services
In manufacturing, a rope producer documented material flow and cut material handling time by 33%. Mapping exposed long travel distances and batch delays, directing layout changes and kanban controls.
Healthcare teams map prescription fulfillment, patient check-in and discharge, lab testing, and documentation. Visual queues and standardized work reduce wait time and errors while protecting clinical quality.
Software groups chart idea-to-release to find queues in coding, testing, deployment, and approvals. The map informs automation of repetitive tasks, fewer handoffs, and smaller batch sizes that match Lean manufacturing steps.
Logistics and services use VSM to balance capacity, shorten cycle time, and stabilize lead times. Clear swimlanes connect operations with customer service and billing to support Value Stream Improvement.
Examples from pharmacies and IT/services to improve speed and accuracy
Retail pharmacies use standard VSM symbols to trace a refill from intake to pharmacist verification. Decision diamonds highlight error checks; data boxes show wait times and rework rates. The result is fewer callbacks and faster pickup, guided by a Continuous Improvement methodology.
In IT services, executives map intake, prioritization, development, and release coordination. The exercise formalizes collaboration and improves communication across the organization, linking service-level targets to flow metrics and sustained Value Stream Improvement.
Across sectors, teams maintain the maps as living documents. Visual cadence reviews tie resource decisions to demand patterns, reinforcing Lean manufacturing steps in daily management.
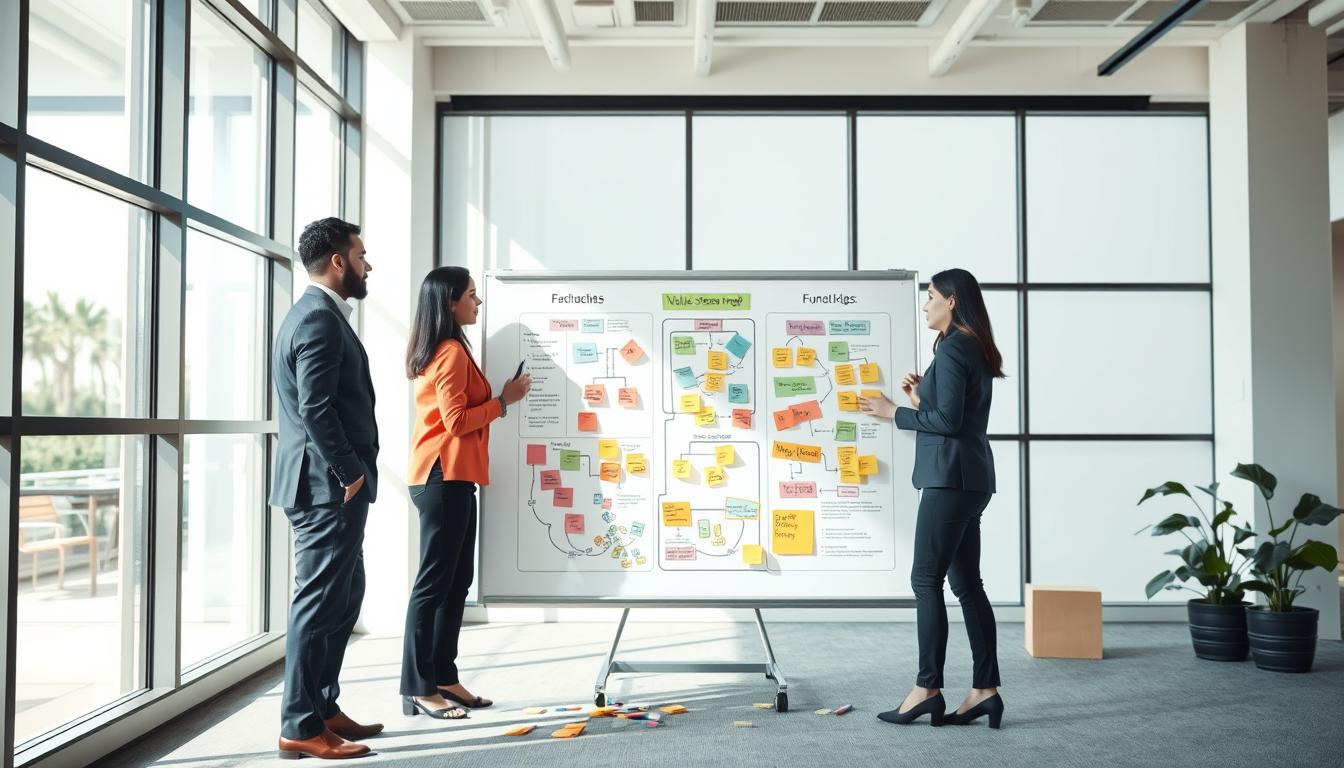
VSM Tools and Techniques to Accelerate the Mapping Workshop
Effective execution hinges on disciplined use of VSM tools and techniques. A brief setup, clear scope, and real data enable teams to visualize the flow of people, processes, information, and inventory. This section provides practical steps for any Value Stream mapping workshop, backed by a concise Value Stream Mapping tutorial approach.

Whiteboards, sticky notes, and flowchart software with VSM symbols
Begin with whiteboards and sticky notes to enhance collaboration and editing speed. Map each step, queue, and information signal in sequence, then add times and inventory levels.
Utilize software like Lucidchart and Edraw for standardized icons. Their VSM symbol libraries reduce rework, maintain a consistent visual style, and expedite documentation for handoff. This combination offers the benefits of tactile speed with the control of digital versions.
Collecting time studies, WIP counts, and throughput data
Employ time studies to capture process and wait times. Gather WIP counts before each step and log changeovers, scrap, and first-pass yield.
Record cycle time, takt time, inventory levels, and resource usage. Calculate Process Cycle Efficiency to quantify value-added time versus total lead time. These metrics transform the map into a reliable baseline for improvement.
Facilitating a Value Stream mapping workshop for cross-functional alignment
Invite sales, operations, finance, quality, IT, and frontline leaders to foster a shared understanding of the flow. Define ownership of each step and list the systems used, from ERP to MES.
Rank delays by impact using data from the map, then set milestones, metrics, and accountable owners. Coach for quick wins to build momentum, and provide a brief Value Stream Mapping tutorial. This approach makes the Value Stream mapping workshop precise, fast, and aligned with business goals.
Diagnosing Waste and Inefficiencies with the VSM Process Guide
The VSM process guide guides teams to dissect each step of the flow. It uses time data to identify the longest tasks, where queues form, and when handoffs slow things down. It also tracks where information is lost or re-entered. This helps classify work into value-added, necessary non-value-added, or waste, setting clear targets for Value Stream Improvement.
Every lane of the map should be evaluated for the seven wastes—overproduction, waiting, transport, overprocessing, inventory, motion, and defects. Calculate Process Cycle Efficiency (PCE) by dividing value-added time by total lead time. Then, compare processes with low ratios against Value Stream Mapping best practices. Open discussions across procurement, operations, customer service, and finance reveal hidden issues.
Identify bottlenecks by their impact on speed, quality, and cost. Prioritize items that add customer value or save time using the VSM process guide. Achieve early wins to build momentum. Then, maintain a steady pace with weekly standups and monthly reviews to keep Value Stream Improvement aligned with changing demands.
Industry evidence shows that visualizing delays, production constraints, and excess inventory uncovers system-level issues. These issues often stem from siloed work. Case studies from rope manufacturing and enterprise IT services highlight stronger communication and cross-team collaboration when teams map end-to-end with Value Stream Mapping best practices.
| Diagnostic Focus | Metric or Method | Waste Exposed | Action Guided by Value Stream Mapping |
|---|---|---|---|
| Queue Hotspots | Wait-time charts; WIP counts | Waiting, Inventory | Balance load; set WIP limits; pull scheduling |
| Slow Operations | Cycle time vs. takt time | Overprocessing, Motion | Standardize work; remove non-value tasks |
| Error-Prone Steps | First-pass yield; defect Pareto | Defects, Rework | Poka‑yoke; root-cause analysis; SPC |
| Excess Movement | Spaghetti diagram; distance logged | Transport, Motion | Cell layout; point-of-use storage |
| Information Gaps | Handoff mapping; data latency | Waiting, Overprocessing | Single source of truth; real-time signals |
| Overall Flow Health | PCE (VA time / lead time) | All seven wastes | Target low-PCE segments for Value Stream Improvement |
Ensure cross-functional participation from the start to gain end-to-end knowledge. Use the VSM process guide to assign issue owners, set deadlines, and define measurable outcomes. Keep progress going with visual controls and brief, data-driven reviews that reinforce Value Stream Mapping best practices.
From Current State to Future State: Value Stream Improvement Best Practices
Transitioning from the current state to a future state demands a structured approach. Teams employ Value Stream Mapping best practices to prioritize issues, design the target flow, and plan delivery stages. This method is grounded in Lean manufacturing and Continuous Improvement, aiming for tangible improvements.
Prioritizing pain points with measurable impact
Assess each constraint based on its impact on throughput, lead time, quality, and cost. Focus on high-impact streams that align with business goals, such as faster fulfillment and enhanced customer satisfaction. Establish clear ownership and standard metrics to ensure the Value Stream Improvement process remains on course.
Decision-making should adhere to Toyota Production System principles, stopping at errors and only performing necessary steps. Align decisions with Value Stream Mapping best practices to ensure consistent measurement and repeatable outcomes across various product lines.
Reducing handoffs, cycle time, and excess inventory
Streamline processes by eliminating redundant approvals, reducing queues, and automating tasks that follow strict rules. Define roles clearly to minimize handoffs and reduce rework loops. In sectors like manufacturing and IT services, such actions have led to significant reductions in cycle time and improved on-time delivery rates.
Ensure balanced workloads to maintain flow and optimize inventory buffers. These actions embody Lean manufacturing principles, safeguarding takt time while preventing localized fixes that compromise overall performance.
Pilot changes, track PCE, and iterate for sustained gains
Implement pilots to test future-state designs before scaling them up. Monitor Process Cycle Efficiency (PCE), cycle time, Work-In-Progress (WIP), and throughput consistently to ensure accurate comparisons.
Utilize short feedback loops and structured retrospectives. The Continuous Improvement methodology supports making small, frequent adjustments. This approach builds momentum while minimizing risks.
Aligning improvements to Lean manufacturing steps and customer outcomes
Ensure every action contributes to customer value by focusing on speed, quality, and reliability. Use milestone plans with clear accountability and regular reviews to align work with service-level objectives and timely delivery.
Document standard work, offer targeted training, and explain the reasoning behind changes. Sustained Value Stream Improvement relies on visible metrics, tested countermeasures, and adherence to Value Stream Mapping best practices across all teams.
Conclusion
Value Stream Mapping Step-by-Step gives teams a clear view of people, processes, information, and inventory. It’s rooted in the Toyota Production System and enhanced by Lean. Across various sectors, it leads to faster lead times and better collaboration. PwC notes that 80–90% of tasks in typical processes add no value, highlighting the significant benefits of Value Stream Improvement.
A data-driven approach is key to lasting improvements. By tracking processing time, wait time, and other metrics, teams can diagnose and design better processes. Standard symbols ensure consistent measurement and benchmarking. Process Cycle Efficiency is a practical metric for tracking progress and comparing value streams over time.
Success comes from cross-functional alignment, clear ownership, and ongoing feedback. When integrated into planning cycles, Value Stream Mapping complements Agile practices. It improves forecasting and boosts throughput while reducing lead times. The Continuous Improvement methodology then turns one-off fixes into ongoing performance management.
Organizations that make Value Stream Improvement a core part of their operations achieve more with less. By integrating Value Stream Mapping into their routines, they create a system for eliminating waste and stabilizing flow. This delivers reliable customer outcomes at scale, all under the Continuous Improvement methodology.
FAQ
What is Value Stream Mapping (VSM) and how does it fit within Lean manufacturing?
Value Stream Mapping is a detailed, visual method for tracing material and information flow from customer request to delivery. It outlines people, processes, inventory, and handoffs to assess the entire flow. Originating in Toyota’s Production System, it’s key in Lean Six Sigma. VSM aims to eliminate waste, reduce lead time, and enhance quality by focusing on optimizing the entire flow, not just local improvements.
Which metrics should a Value Stream Mapping Step-by-Step approach capture?
A thorough VSM process guide tracks processing time, wait times, total cycle time, and work-in-progress. It also monitors inventory levels, quality metrics, resource counts, space usage, and distance traveled. These metrics help calculate process cycle efficiency and pinpoint bottlenecks that hinder throughput or increase costs.
What Lean wastes does VSM reveal, and how are activities classified?
VSM uncovers the seven Lean wastes: overproduction, waiting, transport, overprocessing, inventory, motion, and defects. Activities are categorized as value-added, necessary non-value-added, or waste. This categorization guides Value Stream Improvement by eliminating or reducing non-value work while preserving steps critical to customers.
How do organizations run an effective Value Stream mapping workshop?
Gather cross-functional teams from sales, operations, quality, finance, and IT. Map the current state based on real observations and time studies, not guesses. Use Lean symbols on whiteboards or software like Edraw or Lucidchart. Quantify delays’ impact on speed, quality, and cost. Then, design a future state, assign owners, set milestones, and track metrics like cycle time, throughput, and PCE to maintain Continuous Improvement.
What industries benefit from VSM, including Agile teams?
Manufacturing, healthcare, logistics, finance, and software all use VSM to align sales and operations, reduce handoff errors, and speed up delivery. In Agile settings like Scrum, Kanban, and SAFe, VSM clarifies the flow from idea to release. It improves forecasting and collaboration, supporting iterative changes.
Which VSM tools and techniques speed up analysis?
Teams employ whiteboards and sticky notes for quick collaboration or digital tools with VSM symbol libraries like Edraw and Lucidchart for standardized documentation. Techniques include time studies, WIP counts, queue analysis, error tallies, and distance measurements. A consistent visual style and data capture enable benchmarking across Lean manufacturing steps.
How should improvements be prioritized and sustained?
Focus on pain points with measurable lead time, throughput, quality, or cost impact. Implement changes incrementally, reduce unnecessary handoffs, and right-size inventory. Pilot improvements, monitor PCE, and iterate. Embed feedback loops, retrospectives, and owner accountability to institutionalize Value Stream Mapping best practices.