Types of Inventory: Raw, WIP, Finished Goods Explained
Inventory is a critical component of cash flow and production planning. It encompasses three main categories: raw materials, work-in-progress, and finished goods. These categories move through the production cycle before being converted into the cost of goods sold. Proper classification is essential for effective business supply chain management, boosting operational efficiency in various settings.
Public companies reveal inventory composition to demonstrate the scale and timing of cash invested in stock. For instance, Procter & Gamble in 2022 reported $2.2 billion in materials and supplies, $856 million in work in process, and $3.9 billion in finished goods. These figures highlight the significance of inventory in working capital exposure.
This article delves into the flow of inventory from purchase to production to sale. It explains how inventory is linked to COGS using the ending inventory formula: Beginning Inventory + Purchases – COGS. It also explores the impact of FIFO, LIFO, weighted average, and specific identification on reported profit and balance sheet values. Practical advice connects inventory categories to business supply chain management, operational efficiency, and control measures like ABC analysis, EOQ, and Just-in-Time.
Examples from various sectors, including manufacturing, construction, and healthcare, are provided. The article also discusses technology enablers such as ERP integration and mobile barcoding. By understanding the production cycle and monitoring key checkpoints, companies can reduce lead times, minimize write-down risks, and maintain service levels without excessive stock.
What Is Inventory in Accounting and Operations
Inventory includes raw materials, work-in-progress, and finished goods. It’s held for sale or use in production. Its role is critical, linking daily operations to financial reporting. Accurate valuation is key for pricing, capacity decisions, and audit readiness.
Definition as a current asset on the balance sheet
Inventory is classified as a current asset under U.S. GAAP and IFRS. It’s expected to convert to cash within a year or operating cycle. Companies like Apple and Walmart detail its valuation and measurement in their financial reports.
Valuation considers purchase price, conversion costs, and overhead. Auditors verify counts and costing to ensure recorded amounts match physical stock and costs. Consistent methods are essential for accurate period-over-period analysis.
Connection between inventory and cost of goods sold
Inventory directly affects COGS: as goods ship, costs move from inventory to the income statement. The standard formula—Beginning Inventory + Purchases − COGS—sets ending balances. Higher sales increase COGS and reduce stock, considering returns and shrinkage.
Inventory valuation methods like FIFO, LIFO, weighted average, or specific identification influence timing and amounts. Perpetual and periodic systems also impact when updates occur. Analysts must note these differences when comparing companies.
Why inventory is considered less liquid among current assets
Inventory is the least liquid current asset because it converts to cash after production and sale. It’s excluded from the quick ratio numerator. This highlights the liquidity of other current assets.
This liquidity profile emphasizes the importance of careful balance sheet classification and controls. Clear disclosures help users understand how valuation assumptions affect cash generation and working capital.
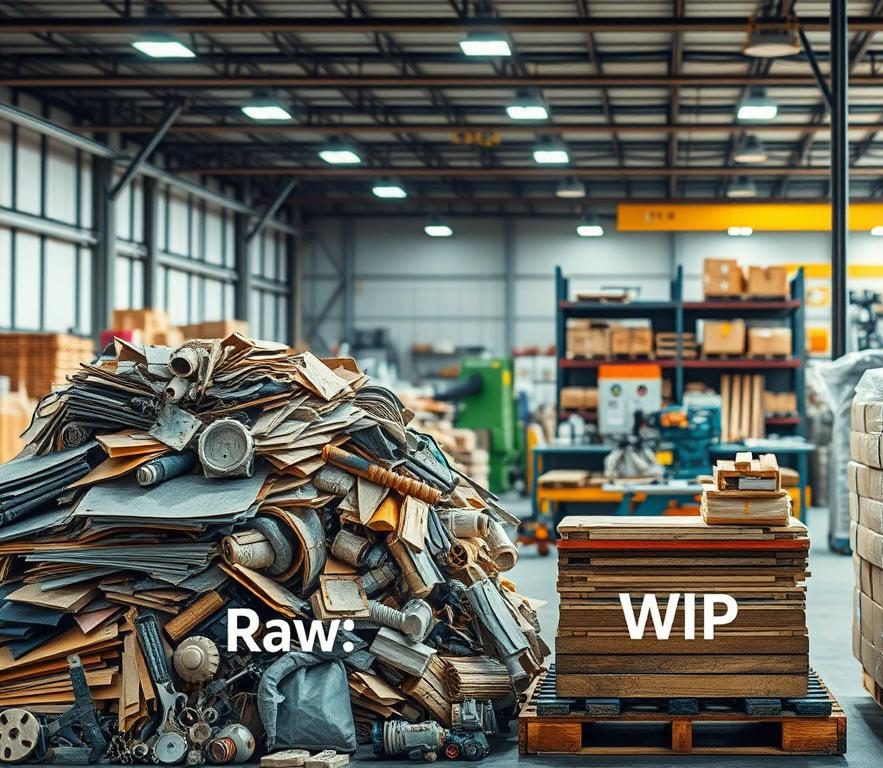
Types of Inventory (Raw, WIP, Finished Goods)
Companies track inventory across the production path to aid in planning, cost management, and revenue timing. The primary inventory types include Raw material inventory, Work in progress inventory, and Finished goods inventory. Many also monitor MRO inventory to ensure equipment uptime and quality.
How businesses classify inventory across the production cycle
Inventory classification is based on usage and stage. Raw material inventory holds inputs not yet processed. Once transformation begins, items move to Work in progress inventory. Units ready for sale or deployment are in Finished goods inventory. MRO inventory supports maintenance and does not impact cost of goods sold.
The same item can change category based on its role. For instance, steel delivered by ArcelorMittal is a finished product for the mill but raw material for Ford. The classification depends on who holds the stock and its intended use.
Examples by industry: manufacturing, construction, medical
- Manufacturing: Cocoa, milk, and sugar are Raw material inventory for ice cream. Mixes in the churn are Work in progress inventory. Packed pints become Finished goods inventory for shipment to retailers such as Kroger.
- Construction: Lumber, rebar, and copper pipe are Raw material inventory before installation. Framed sections on-site are Work in progress inventory. Completed prefab panels ready for delivery are Finished goods inventory for a component supplier.
- Medical: Vaccine vials after final mixing and testing qualify as Finished goods inventory. Sterile syringes and PPE count as MRO inventory that supports care but does not enter the product.
Differences between direct materials and indirect supplies
Direct materials are traceable to a product and measured in bills of materials, such as flour in a snack plant or aluminum sheets for cans. These belong in Raw material inventory, advance through Work in progress inventory, and end in Finished goods inventory as embedded cost.
Indirect supplies are operational. Lubricants, cutting tools, filters, hard hats, labels, and office consumables fall under MRO inventory. They aid reliability and safety but do not become part of the saleable unit, so they are expensed through overhead.
| Category | Primary Role | Ownership Example | Cost Treatment | Common Controls |
|---|---|---|---|---|
| Raw material inventory | Inputs awaiting processing | Steel coils at Ford; cotton bales at Levi Strauss & Co. | Capitalized into product cost | Quality specs, reorder points, supplier lead times |
| Work in progress inventory | Partially completed units | Assemblies on a Toyota line; framed walls on a Turner Construction site | Accumulates material, labor, and overhead | WIP tracking, routing, takt alignment |
| Finished goods inventory | Sale-ready items | Packaged ice cream at Nestlé; prefab panels at Simpson Strong-Tie | Held at standard or actual cost until sale | Cycle counts, demand forecasting, service-level targets |
| MRO inventory | Maintenance and operations support | Bearings for Deere plants; PPE at Mayo Clinic | Expensed via overhead, not in unit cost | Min-max by criticality, vendor-managed stock, kitting |
Raw Material Inventory Fundamentals
Raw material inventory is key to production capacity and cash flow. It connects procurement timing, acquisition costs, and warehouse storage to product availability. Effective inventory control prevents stockouts, reduces cycle times, and stabilizes delivery schedules.
What counts as raw materials and why tracking matters
Raw materials are inputs before processing and directly relate to the final product. They include base metals, fibers, resins, chemicals, and timber. Accurate tracking minimizes write-offs, enhances planning, and strengthens supplier negotiations.
ERP systems from SAP or Oracle track receipts and issues in real-time. Barcode and RFID scanning improve data accuracy, enhance inventory control, and reduce line delays.
Acquisition, storage, and stockout prevention
Commodity inputs’ prices can fluctuate due to weather, energy costs, and logistics issues. Monitoring acquisition costs by lot and vendor clarifies true landed cost and margin exposure. Hedging and should-cost analysis add pricing discipline.
Effective warehouse storage protects quality and supports fast picking. Location control, cycle counts, and reorder points prevent stockouts during demand spikes. Perpetual updates flag variances sooner than periodic counts, reducing unplanned downtime.
Illustrative examples: steel for autos, cotton for apparel, lumber for builds
Automakers like General Motors budget steel grades by model and plant to align coil deliveries with takt time. Tracking consumption by work order ties Raw material inventory to weld, stamp, and paint schedules.
Apparel producers sourcing cotton through merchants monitor fiber class, moisture, and mill yield. Accurate receipts and storage rules curb waste, improve inventory control, and stabilize acquisition costs across seasons.
Construction suppliers handling lumber for residential builds record dimensions and treatments at receipt. Clear bin locations, moisture safeguards, and demand signals from project plans support warehouse storage efficiency and stockout prevention on active sites.
Work-in-Progress Inventory Explained
Work in progress inventory includes goods that have moved past raw materials but are not yet ready for sale. It involves accounting for consumed materials, applied direct labor, and a portion of factory overhead. This concept applies to various sectors, such as vehicles on assembly lines at Ford, unroasted coffee beans at Starbucks suppliers, and custom garments in production at Levi Strauss partners.
Tracking work in progress inventory is essential for maintaining visibility in manufacturing. It involves monitoring quantity, cost, and production stages. This approach helps identify bottlenecks early, preventing queues from forming on the production floor.
Mobile barcoding systems, integrated with ERP software like SAP or Oracle NetSuite, track important data. They record time stamps, lot and serial numbers, and scrap events. Continuous scanning helps planners update production schedules, leading to more efficient labor allocation and reduced idle inventory.
Manufacturing traceability platforms from companies like Siemens, Rockwell Automation, and Dassault Systèmes link raw materials to finished products. This connection aids in accurate forecasting, supports recall readiness, and shortens cash cycles. By combining these systems with lean dispatch rules, WIP tracking ensures a smooth production flow that matches demand.
| Industry Example | Typical WIP Stage | Primary Data Captured | Key Control Benefit |
|---|---|---|---|
| Automotive assembly | Body-in-white to paint | VIN, station scan, takt time | Early warning on production bottlenecks |
| Coffee processing | Cleaning to roasting | Lot ID, moisture level, dwell time | Stable roast profiles and cost accuracy in process inventory |
| Apparel manufacturing | Cutting to sewing | Bundle ticket, size run, piece count | Balanced lines and reduced Work in progress inventory |
| Chemicals and food | Mixing to finishing | Batch ID, temperature, hold time | Traceable lots and improved manufacturing visibility |
Finished Goods Inventory and Sale Readiness
Finished goods inventory holds completed products ready for customer delivery or internal use. It ensures items meet quality standards, legal requirements, and packaging standards. The classification of goods as finished can vary between companies, like steel being a raw material for Ford but a finished product for ArcelorMittal.
Cost components: materials, direct labor, and overhead allocation
Inventory costs include raw materials, direct labor, and overhead. Standard and activity-based costing allocate indirect expenses into unit costs. This method applies to all inventory valuation methods, such as FIFO, LIFO, and specific identification.
Accurate cost tracking ensures inventory values are correct. Bills of materials and routing times help reduce errors. This improves the readiness of products for sale across different channels.
Readiness criteria and use-based classification nuances
Readiness depends on the intended use and regulatory compliance. In healthcare, vaccines are considered finished when mixed and stored properly. For electronics, packaging and firmware must be complete before they are ready for sale.
What is considered finished can vary between models. A contract manufacturer might treat subassemblies as finished, while an OEM views them as work-in-progress. Clear guidelines prevent misclassification and reduce returns.
Subtypes to monitor: in-transit, cycle, slow-moving, dead, obsolete
In-transit inventory is at risk of loss or damage during transfer. Cycle stock supports regular order fulfillment, requiring quick and reliable replenishment.
Slow-moving items strain working capital. Dead stock lacks demand, while obsolete inventory no longer meets market or shelf-life standards. Examples include outdated chipsets or expired foods.
Mobile scanning and ERP tracking enhance accuracy and confirm inventory status. These systems help manage inventory, reduce write-downs, and optimize stock levels. They also identify items for disposal.
Inventory Valuation Methods and Their Impact
Inventory valuation is key in determining the cost of goods sold and the ending inventory value on the balance sheet. The choice of method significantly impacts profit margins, tax liabilities, and various performance metrics. This makes it essential to analyze inventory valuation methods to ensure fair comparisons across different companies.
FIFO, LIFO, weighted average, and specific identification
Inventory valuation methods like FIFO and LIFO dictate how costs are allocated to COGS and inventory. FIFO uses the oldest costs first, while LIFO uses the most recent costs. This results in different inventory values and COGS. Weighted average cost, on the other hand, averages total costs across all units, reducing volatility. Specific identification assigns actual costs to unique items, which is beneficial for luxury brands and high-value products.
In the U.S., GAAP allows the use of LIFO, whereas IFRS prohibits it. This difference affects cross-border comparisons and requires adjustments when benchmarking companies like Walmart and Carrefour.
Inflation effects: why LIFO raises COGS and lowers ending inventory
During inflation, LIFO increases COGS by incorporating higher recent costs. This results in higher COGS and lower ending inventory compared to FIFO. FIFO, on the other hand, shows lower COGS and higher inventory due to the use of older cost layers.
Weighted average cost mitigates price swings by blending costs across layers. Specific identification accurately tracks costs for high-value, low-volume items, such as limited edition products or spare parts.
Periodic vs. perpetual systems and timing of valuation
Inventory valuation methods differ in their timing. Periodic systems apply FIFO, LIFO, or weighted average cost at the end of each period, using aggregated purchases. Perpetual systems update costs after each transaction, leading to different COGS and inventory values even with the same assumptions.
Companies using SAP or Oracle NetSuite often prefer perpetual systems for tighter control. Smaller retailers might opt for periodic systems due to their simplicity and the need for cycle counts.
| Method | Cost Flow Assumption | Typical Effect in Inflation | Best-Fit Use Case | System Timing Sensitivity |
|---|---|---|---|---|
| FIFO | Oldest costs to COGS first | Lower COGS, higher ending inventory | Perishables and fast-moving consumer goods | Differences arise between periodic and perpetual layers |
| LIFO | Newest costs to COGS first | Higher COGS, lower ending inventory | U.S. firms seeking tax alignment with current costs | Perpetual LIFO can diverge from periodic LIFO results |
| Weighted Average Cost | Blended cost across units | Moderated COGS and inventory volatility | High-volume, indistinguishable items | Running average under perpetual vs period-end average |
| Specific Identification | Actual unit cost assignment | Tracks real margins by item | Luxury, aerospace, custom machinery | Requires precise tracking in both systems |
Analysts must adjust for FIFO vs LIFO differences and reconcile LIFO reserves when disclosed. They should also note whether calculations come from periodic or perpetual records. This ensures accurate comparisons of margins and turnover.
Inventory Management and Control Strategies
Effective Inventory management is about aligning policy, process, and technology. It aims to balance service levels and carrying costs. EOQ helps set efficient order sizes and production quantities for internal runs. ABC analysis ranks items by consumption value, directing labor and capital to A-class parts.
Lean operations use Just-in-Time, relying on stable suppliers and short lead times. Safety stock and anticipatory builds help manage demand swings and logistics risks. Yet, oversized buffers can increase obsolescence and capital tied up in slow-moving items. Clear reorder points, lead-time assumptions, and review cadence ensure consistency across plants and distribution centers.
Counting methods vary from periodic physical counts to perpetual tracking in ERP systems. Systems from SAP, Oracle, Microsoft Dynamics 365, and NetSuite are used. Barcode and QR workflows reduce errors, offer real-time visibility, and alert for low stock. Structured item masters enhance category-level reporting and make ABC analysis consistent each quarter.
Calibrating EOQ, Just-in-Time, and safety stock with current lead times and demand variability improves purchase timing. This reduces waste. Strong Inventory management also prevents dead stock by tightening review cycles and enforcing disposition rules. Integrating Inventory control metrics into finance dashboards is key.
Inventory Tracking Technology and Data Visibility
Recent breakthroughs in sensors, scanning, and software are transforming Inventory tracking. When combined with ERP integration, data flows seamlessly across procurement, production, and logistics. This provides real-time visibility, leading to lower error rates, faster cycle counts, and tighter control over multi-site networks.
Perpetual versus periodic tracking in practice
Periodic systems update quantities and valuation at set intervals. They are suitable for small catalogs and low transaction volumes. Yet, they delay the detection of exceptions and adjustments in costs.
Perpetual systems, on the other hand, record every transaction as it happens. This allows for immediate checks on variances, shrinkage detection, and cost updates. It enhances audit trails and enables quick replenishment.
Mobile barcoding, ERP integration, and real-time updates
Mobile barcoding and QR scanning extend the system of record to the aisle and line-side. With ERP integration, scans trigger automated validations, lot assignment, and location updates. This provides real-time visibility for planners and finance.
Vendors like SAP, Oracle NetSuite, and Microsoft Dynamics 365 offer APIs for handhelds from Zebra and Honeywell. These tools reduce data latency, lower entry errors, and standardize workflows from receiving to staging.
Traceability for raw materials, WIP checkpoints, and finished goods
For raw inputs, mobile tools capture supplier lots, dates, and conditions at intake. This supports traceability for regulated materials and prevents stockouts due to seasonality or spoilage.
In WIP, defined scan checkpoints log conversions by batch and work center. Automated capture secures end-to-end genealogy across preparation, mixing, and finishing. This record enables rapid containment and targeted recalls.
For finished goods, scan-driven pick-pack-ship, in-transit updates, and field mobility keep multi-location positions synchronized. Traceability extends to delivery, lowering misdelivery and expiry risk. It sustains accurate Inventory tracking with continuous real-time visibility.
Inventory Metrics that Matter
Effective inventory analysis connects shop-floor activity to financial statements. Three key measures are essential: the ending inventory formula, the Inventory turnover ratio, and days inventory on hand. These metrics help assess sell-through speed, carrying costs, and cash cycle discipline across different product lines.
Before comparing peers, analysts must align period boundaries and valuation methods. The choice of FIFO, LIFO, or weighted average cost affects COGS, altering turnover and days metrics. The use of perpetual and periodic systems also impacts timing and requires careful normalization.
Ending inventory formula: Beginning + Purchases – COGS
The ending inventory formula connects operating activity to reported balances: Beginning Inventory + Purchases – COGS. It reveals how buying decisions and consumption rates affect stock levels across raw materials, work-in-progress, and finished goods.
Use average inventory when evaluating trends across quarters. Reconcile cycle, in-transit, slow-moving, and obsolete items to refine working capital planning and avoid overstated availability.
Inventory turnover ratio and days inventory on hand
The Inventory turnover ratio, calculated with COGS over average inventory, measures sell-through efficiency. Higher turnover reduces holding costs but may indicate stockout risk if safety stock is low. Pair this with days inventory on hand to express the same dynamic in days.
Track these metrics by category and location to highlight bottlenecks. A spike in days inventory on hand often signals demand variability, production delays, or pricing misalignment.
Linkages to accounts payable turnover and purchasing
Purchasing cadence impacts both inventory levels and supplier cash timing. Accounts payable turnover, measured as supplier payments relative to average payables, indicates the pace of settlement on credit-based buys. Faster payment rhythm can secure priority allocation but tightens cash.
Align purchase order release, lead times, and payment terms with target turnover and days inventory on hand. This balance ensures service levels, carrying costs, and liquidity across the supply base.
| Metric | Formula | Operational Signal | Financial Implication | Adjustment Notes |
|---|---|---|---|---|
| Ending Inventory | Beginning Inventory + Purchases – COGS | Net stock build or draw | Impacts current assets and working capital | Reclass slow-moving and obsolete items |
| Inventory Turnover Ratio | COGS ÷ Average Inventory | Sell-through speed | Lower carrying cost at higher turns | Use category-level averages for precision |
| Days Inventory on Hand | 365 ÷ Inventory Turnover Ratio | Duration stock remains on hand | Cash tied up per day in inventory | Evaluate by site to expose bottlenecks |
| Accounts Payable Turnover | Purchases ÷ Average Accounts Payable | Supplier payment pace | Alters cash conversion timing | Reconcile purchases with COGS and freight-in |
| Purchasing Cadence | PO Frequency × Average Lot Size | Flow of inbound materials | Drives inventory and price variances | Sync with lead times and safety stock |
Conclusion
Inventory is a critical juncture where accounting and operations converge. It encompasses raw materials, work-in-progress, and finished goods, each with its own set of control needs and financial implications. The choice of inventory valuation methods, such as FIFO, LIFO, weighted average, and specific identification, significantly impacts reported Cost of Goods Sold (COGS) and ending inventory balances. This, in turn, influences profitability and working capital.
In 2022, Procter & Gamble’s financial reports highlighted the importance of inventory composition within a global context. They demonstrated how the mix and valuation of inventory can profoundly affect financial outcomes.
Operational discipline is key to achieving inventory efficiency and bolstering supply chain performance. Techniques like EOQ, ABC analysis, and Just-in-Time inventory systems help minimize holding costs while maintaining service levels. The integration of perpetual inventory systems with ERP and mobile barcoding provides real-time inventory visibility. This is from raw material receipt to finished goods distribution, including in-transit tracking.
This real-time data enables tighter inventory controls and faster decision-making across various operational settings in the United States.
Effective measurement is essential. Metrics such as the ending inventory formula, inventory turnover ratio, and days on hand reveal cycle speed and risk levels. When procurement aligns with accounts payable turnover, companies can optimize cash flow, reduce stockouts, and lower the risk of inventory obsolescence. This leads to enhanced working capital, more resilient supply networks, and a clearer understanding of unit economics to enterprise value.
A structured approach to inventory management—sound valuation, accurate systems, disciplined management, and consistent metrics—is vital for sustainable gains. Executives who adopt standardized practices can significantly improve inventory efficiency, stabilize supply chain performance, and enhance decision-making for long-term success.
FAQ
How is inventory defined in accounting, and why is it recorded as a current asset?
Inventory is seen as a current asset because it’s expected to turn into cash within a year. It includes raw materials, work in progress, and finished goods. This classification on the balance sheet highlights its near-term economic value. On the income statement, inventory affects cost of goods sold as items are sold.
How does inventory connect to COGS and the ending inventory formula?
When goods are sold, their costs move from inventory to COGS, reducing inventory levels. The ending inventory formula—Beginning Inventory + Purchases – COGS—links operational movements to financial reporting. Different valuation methods and systems affect inventory valuation and COGS.
Why is inventory considered less liquid than other current assets and excluded from the quick ratio?
Inventory needs selling and fulfillment to convert to cash, introducing time and market risks. It’s not easily convertible without a transaction, so it’s often left out of the quick ratio. This exclusion helps assess short-term liquidity without relying on sales assumptions.
What are the primary types of inventory and how are they classified across the production cycle?
The main types of inventory are raw materials, work in progress, and finished goods. Classification depends on their use and production stage. For example, steel is a raw material for an automaker but a finished good for a metals supplier.
Which examples illustrate inventory types in manufacturing, construction, and medical sectors?
In manufacturing, steel, cotton, and food inputs move from raw to work in progress to finished goods. Construction treats lumber, steel, and copper as raw materials across projects. Medical settings have products like vaccines as finished goods only when fully mixed and ready for use.
What counts as raw materials, and why does tracking them matter?
Raw materials are inputs not yet processed, like steel for autos or lumber for construction. Tracking them precisely reduces stockouts and line stoppages. Perpetual tracking with ERP and mobile barcoding improves inventory control and accuracy.
How can companies prevent stockouts and manage storage for raw materials?
Companies use safety stock, reorder points, and EOQ to balance costs. Environmental controls and reliable tracking mitigate spoilage and delays. Integrated ERP systems with barcode scanning provide real-time visibility for inventory management.
What defines work in progress (WIP), and why is it challenging to measure?
WIP includes partially completed units and associated costs. It’s hard to measure because materials transform and intermingle. Checkpoint scanning and traceability software improve tracking and lead-time management.
What determines when finished goods are sale-ready, and what subtypes should be monitored?
Finished goods are ready when they meet final specifications and can be sold or used immediately. Monitoring subtypes like in-transit and slow-moving stock supports inventory control. Mobile-enabled systems strengthen inventory control.
How do FIFO, LIFO, weighted average, and specific identification affect profits and balance sheets?
Cost flow assumptions change COGS and ending inventory. In inflation, LIFO raises COGS and lowers ending inventory; FIFO does the opposite. Weighted average smooths cost volatility, while specific identification assigns actual costs to unique items. These methods influence reported profit and inventory valuation.
What is the difference between periodic and perpetual inventory systems for valuation?
Periodic systems compute valuation adjustments at period end, while perpetual systems update after each transaction. Even under the same method, periodic and perpetual systems can produce different COGS and ending inventory figures. Perpetual systems support tighter inventory control and timely financials.
Which inventory management and inventory control models reduce carrying costs and stockouts?
EOQ optimizes order size by balancing ordering and holding costs. ABC analysis prioritizes control based on consumption value. Just-in-Time (JIT) compresses lead times to lower on-hand balances. Safety stock strategies buffer demand variability. These practices improve inventory turnover ratio and working capital efficiency.
How do ERP platforms and mobile barcoding strengthen inventory tracking?
ERP integration with mobile barcoding enables real-time inventory tracking, location accuracy, and reliable data capture. For raw materials, it supports replenishment and storage control. For finished goods, it improves pick accuracy and in-transit visibility.
What is the ending inventory formula and why does it matter for analysis?
Ending Inventory = Beginning Inventory + Purchases – COGS. This formula reconciles operational flows with financial reporting, anchoring valuation and performance metrics. Accurate inputs enable meaningful comparisons across periods and companies, adjusting for differing cost flow assumptions.
How should companies interpret the inventory turnover ratio and days inventory on hand (DIH)?
Inventory turnover ratio, typically using COGS in the numerator, shows how frequently inventory converts to sales. DIH translates turnover into days on hand. Higher turnover lowers carrying costs but may signal stockout risk if too high. Use average inventory for normalization and monitor slow-moving and obsolete stock.
How do purchasing cadence and accounts payable turnover relate to inventory levels?
Many purchases of raw materials and components are on credit, linking AP turnover to buying patterns. Faster AP turnover can indicate tighter payment terms or stronger cash positions. Aligning purchasing with demand forecasts stabilizes inventory balances and cash flow.
What real-world data illustrate the materiality of inventory on financial statements?
Procter & Gamble reported in 2022 approximately .2 billion in materials and supplies, 6 million in work in progress, and .9 billion in finished goods. These figures show how inventory composition affects balance sheet totals, COGS timing, and inventory valuation under chosen accounting methods.