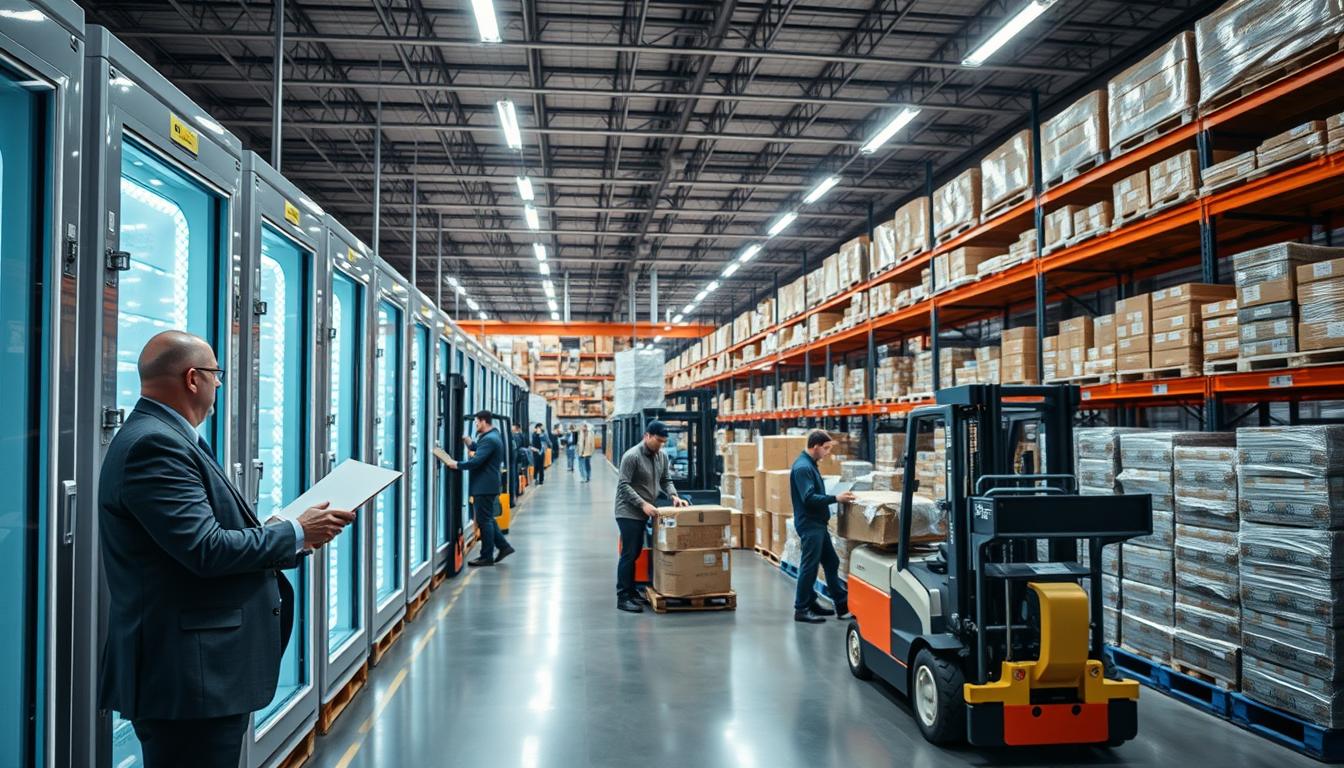
Lineage Logistics: Optimizing Your Supply Chain
Cold chain performance in the United States faces challenges due to fragmented order profiles and tighter delivery windows. Small errors in temperature-controlled logistics can significantly increase dwell time, rework, and spoilage risk. This section examines lineage logistics through a data-driven lens, essential for supply chain management teams focused on cost, service, and risk.
The main issue lies in coordination. Decisions on cold storage, carrier lanes, inventory placement, and in-building flow are often made in isolation. When these decisions are not synchronized, facilities face increased variability, transportation runs inefficiently, and inventory buffers grow in the wrong locations.
This article views lineage logistics as a holistic operator and analytics partner, not just a last-mile solution. It references market discussions, including the fact that last mile can account for about 40% of total cold chain logistics costs in food service. Lineage boasts over 420 temperature-controlled warehouses and a team of more than 50 supply chain engineering specialists.
The analysis delves into end-to-end modeling, facility location, inventory optimization, and routing efficiency. It also covers the execution phase after selecting a network design. A case study shows a path to $2 million in annual transportation cost savings through network adjustments. The following sections will translate these strategies into actionable steps for supply chain management leaders in temperature-controlled logistics and cold storage solutions.
Cold Chain Pressure in the United States: Why Optimization Matters
In the U.S., cold chains face intense cost and service pressures. The demand for smaller orders, faster delivery, and more SKUs within strict temperature ranges is growing. For those managing temperature-controlled logistics, small planning errors can significantly impact labor, capacity, and on-time performance.
These pressures affect supply chain management decisions, from scheduling to inventory positioning. For food distribution services, variability increases risk. More touches, transfers, and time outside ideal conditions are common. Refrigerated warehousing can help manage demand swings, but only if planning and execution are aligned.
How e-commerce growth increases complexity in temperature-controlled logistics
E-commerce growth has fragmented cold chains, leading to more mixed-case orders and narrower delivery windows. SKU variety also increases, raising the risk of pick errors and misloads in refrigerated warehousing.
Service expectations are tightening. Customers track ETAs, request changes, and expect quick issue resolution. This adds coordination work across teams, carriers, and store-level receivers, making it challenging when orders include different temperature items.
Why the last mile can represent about 40% of total cold chain logistics costs in food service
The last mile, the final leg to the customer, accounts for about 40% of total cold chain logistics costs in food service. Costs are driven by labor-intensive stops, unloading time, compliance checks, and the resources needed for safe and timely delivery.
Several factors inflate last-mile costs, yet many are outside shipper control. These include labor and fuel swings, inefficient routes, delivery delays, and lack of transparency across handoffs. For food distribution services, these factors can lead to reattempts, expedite fees, and overtime, eroding planned margins.
What cost, service-level, and spoilage risks look like in real refrigerated distribution
In refrigerated distribution, delays and extra handling increase exposure to temperature excursions. Congestion at docks, missed appointments, and unplanned cross-docks can extend dwell time, raising the risk of damage and spoilage. Waste increases, while maintaining fill-rate and on-time metrics becomes more challenging.
Cost pressure often builds across various areas, including supplier-to-warehouse coordination, facility capacity, and lane design. Tighter supply chain management and better data use can reduce friction, stabilize execution, and make temperature-controlled logistics less volatile.
| Pressure Point | What Changes in the Network | Common Cost Impact | Service-Level and Quality Exposure |
|---|---|---|---|
| Order fragmentation from e-commerce | More split picks, mixed-temperature carts, and shorter cutoffs in refrigerated warehousing | Higher handling minutes per case and more staging labor | More pick errors and longer door-open time during loading |
| Last-mile density and stop time | More stops per route and tighter appointments for food distribution services | Added driver hours, reattempts, and fuel burn from route drift | Late deliveries and longer product exposure during unload |
| Route inefficiency and delays | More idling, detours, and missed windows across temperature-controlled logistics lanes | Overtime, accessorial fees, and higher cost per delivered case | Temperature excursions and higher damage and spoilage risk |
| Low transparency across handoffs | Slower exception handling between dispatch, warehouse, and receiver | Expedites and avoidable rework in supply chain management workflows | Missed scans, weak traceability, and inconsistent chain-of-custody |
lineage logistics as a Cold Storage and Supply Chain Management Partner
For U.S. food and beverage shippers, maintaining temperature control is a complex system, not a simple handoff. lineage logistics focuses on full-chain tradeoffs. It links cold storage solutions to service targets, cost, and risk.
Unlike treating warehousing and linehaul as separate budgets, supply chain management decisions are evaluated together. This approach supports transportation and storage solutions that align with how products move through docks, yards, and freezer aisles.
How a holistic cold chain approach connects storage, transport, inventory, and flow
Lineage’s “full-chain” approach views facilities, transportation networks, inventory, and demand patterns as interconnected variables. It considers ports, labor plans, automation, and warehouse flow in the same model. Each constraint can influence the economics of a lane.
When a shipper adjusts the facility footprint or inventory placement, miles and loading patterns change. These choices also impact congestion, dwell time, and in-building travel. So, transportation and storage solutions must reflect execution on the warehouse floor.
What a large temperature-controlled network enables for flexible delivery options
Scale offers flexibility when demand shifts or lead times shorten. lineage logistics boasts over 420 temperature-controlled warehouses. This network expands routing choices and aligns cold storage solutions with customer service needs.
This network also supports a variety of delivery formats, from small parcel to full truckload, based on shipper requirements. It creates room to balance order profiles, slotting, and replenishment cycles without relying on a single node.
| Cold chain decision point | What changes in the network | Execution variable that must be planned | Resulting impact area |
|---|---|---|---|
| Facility footprint (add, expand, or rebalance sites) | Lane length, number of stops, and transfer points | Dock capacity, yard space, and appointment cadence | Linehaul cost and on-time performance |
| Inventory placement (forward stock vs. pooled stock) | Replenishment frequency and safety stock by node | Pick paths, slotting density, and replenishment labor | Fill rate and working capital exposure |
| Mode and load design (LTL vs. TL; pallet builds) | Loading patterns, cube utilization, and delivery windows | Staging space, freezer door time, and temperature checks | Cost per case and spoilage risk |
| Port and inbound planning (dray and deconsolidation) | Inbound timing, dwell, and upstream variability | Receiving labor, put-away speed, and congestion control | Lead time stability and demurrage exposure |
Why operational execution matters after the model chooses the network
Optimization models can suggest a footprint, but service relies on daily operating limits. Lineage emphasizes that it supports operating the chosen network. It considers dock schedules, yard moves, and warehouse-floor constraints.
This focus on execution is backed by specialized talent. Lineage has engineers, analysts, modelers, and data scientists, including over 50 in modeling, optimization, and data science. They use tested methods and customer projects for measurable results.
In practice, supply chain management improves when plans translate into daily work. This link is where transportation and storage solutions and cold storage solutions either succeed or create new bottlenecks.
Refrigerated Warehousing and Cold Storage Solutions for Food Distribution Services
Refrigerated warehousing is more than just space for shippers. It’s about the operating limits that shape costs and service. Cold storage solutions work best when slotting, travel paths, dock schedules, and equipment capacity are planned together. This approach supports steady outbound performance for food distribution services and tight execution for frozen food logistics.
What to look for in refrigerated warehousing for food, beverage, and imports
Start by looking at data that shows how the building operates, not just its pallet positions. Important factors include facility constraints, pallet movement, temperature zones, dwell time, and door capacity. Providers that understand these details can align labor plans and appointment windows with real throughput limits.
Imports introduce more variability. A good design considers ports of entry or departure, ports of discharge, dray cycles, and staging inventory near demand. When these flows are planned with cold storage solutions, shippers can reduce temperature exposure at handoffs and smooth receiving surges that disrupt food distribution services.
| Evaluation area | Operational measure used on-site | What it affects in execution | Typical signal of risk |
|---|---|---|---|
| Door and dock capacity | Trailer turns per door per shift; appointment adherence | Inbound staging time and outbound cutoffs in refrigerated warehousing | Frequent reschedules and long driver dwell times |
| Internal travel and slotting | Average pick path length; pallet touches per order | Labor hours, equipment utilization, and freezer congestion | High re-handles and rising overtime |
| Temperature zone design | Zone changeovers; time out of temperature control | Quality protection across cold storage solutions | Hot spots, frost buildup, or repeated product holds |
| Import surge readiness | Receiving rate per hour; flex labor coverage | Port-to-warehouse flow stability for food distribution services | Backlogs after vessel discharge or rail ramp peaks |
Reducing handling touches to help lower damage and spoilage risk
Each extra touch increases the risk of damage, mis-picks, and temperature drift. In frozen food logistics, the cost is evident through claims, write-offs, and rework time. Fewer touches are also easier to audit because movements are simpler to trace by scan events and timestamps.
Coordination across redistribution and the middle mile can reduce touches by design. When inbound loads are planned for put-away locations that match outbound demand, product can move with fewer re-stacks and less cross-dock churn. This operating discipline strengthens waste control while keeping food distribution services responsive during demand swings.
How warehouse flow impacts congestion, labor, and throughput in cold storage operations
Warehouse flow is a measurable lever, not a soft concept. Flow design sets where pallets stage, how forklifts interact with pedestrian lanes, and how quickly orders clear the dock. In refrigerated warehousing, small layout frictions can create backups that look like a labor problem but are often a movement problem.
When cold storage solutions include flow and placement rules, schedules can match real capacity and reduce peak-hour crowding. Cleaner movement reduces bottlenecks that drive congestion near doors and battery charging areas. This steadier pace supports more predictable outbound service levels for frozen food logistics without pushing labor into costly surge patterns.
Middle Mile Strategy: Unlocking Hidden Savings Before the Last Mile
In U.S. food distribution, many cost reviews focus on the doorstep. Yet, the middle mile often sets the cost curve earlier. This is due to supplier pickups, appointment times, and warehouse receiving windows not aligning. For temperature-controlled logistics, small timing errors can lead to detention, rework, and rushed recovery moves.
Lineage Logistics views this as a coordination issue, not a single-lane problem. The goal is to move product from supplier to warehouse with reliable schedules. This includes stable mode choices and fewer idle hours. When these elements align, transportation and storage solutions perform with less friction. Supply chain management teams then gain steadier service levels.
Why middle mile coordination is a major lever for transportation and storage solutions
Middle mile coordination links purchase orders to dock capacity and driver time. It requires clean appointment setting, realistic transit plans, and execution that respects facility constraints. If a load misses a receiving slot, the warehouse absorbs the shock through overtime, congestion, and extra moves.
That operational drag shows up later as last-mile disruption. Late inbound freight can force split shipments, shorter delivery windows, and higher expediting rates. In temperature-controlled logistics, added dwell time also raises temperature excursion risk, which increases claims and shrink.
Examples of incremental changes that can drive major cost impact
Several adjustments can shift cost without changing customer promises. The common theme is higher utilization of assets and fewer avoidable miles. This is guided by lane data and capacity rules. Lineage Logistics often points to practical levers that fit day-to-day execution.
Nontraditional modes of transportation on select lanes to stabilize capacity during peak weeks.
Ride-sharing concepts for LTL shipments to consolidate partial pallets and reduce low-fill moves.
Rethinking redistribution to limit “touch-and-send” patterns that add extra legs between cold facilities.
These changes work best when tested against network rules, not guessed in isolation. Engineering teams typically evaluate facility throughput, lane rates, and inventory placement before rollout. This approach supports supply chain management decisions with measurable trade-offs.
How middle mile improvements ripple into fewer touches and less waste
Each extra handoff increases handling events, and each event carries a damage and spoilage probability. Better middle mile planning reduces unload-and-reload cycles, limits cross-dock dwell, and protects case integrity. The result is less product loss and fewer quality holds.
Fewer touches also reduce energy use inside cold rooms and cut rework labor. Over time, transportation and storage solutions become easier to staff and schedule. The inbound flow is more predictable. For temperature-controlled logistics, that steadier flow supports compliance and reduces avoidable waste.
| Middle mile lever | Execution change | Cost mechanism | Quality and waste effect |
|---|---|---|---|
| Supplier-to-warehouse scheduling | Align pickup times with dock windows and carrier hours | Less detention, fewer rework moves, lower overtime | Reduced dwell time lowers spoilage exposure |
| Mode selection | Use nontraditional modes where service tolerances allow | Improved capacity access and rate stability on constrained lanes | Fewer late arrivals reduce temperature risk events |
| LTL consolidation | Apply ride-sharing concepts for LTL shipments across compatible origins | Higher trailer utilization and fewer partial moves | Fewer transfers reduce handling damage |
| Redistribution design | Limit extra facility stops by placing inventory closer to demand | Fewer legs and lower accessorial charges | Reduced touchpoints cut waste and shrink |
Last Mile Delivery in Temperature-Controlled Logistics
Last mile delivery is the final leg, bringing goods to stores, restaurants, or homes. It accounts for about 40% of cold chain logistics costs in the food service sector. Drivers face dense stop patterns, tight delivery windows, and strict handling rules.
Cost and performance pressures are evident in labor, fuel, inefficient routes, delays, and lack of transparency. These issues limit a shipper’s control, exacerbated by volume fluctuations. For food distribution, even minor errors can lead to credits, reschedules, and product risks.
lineage logistics views last mile delivery as a part of a large cold chain network. With over 420 temperature-controlled warehouses, it supports various delivery setups. The aim is to align order size, service level, and dock constraints with suitable transportation and storage solutions.
Upstream decisions also impact last mile results. Incorrect inventory staging can lead to longer routes and clustered stops. Planned redistribution to reduce touches and congestion improves delivery stability and reduces exceptions.
| Constraint | How it shows up in operations | Operational lever tied to network design | Metric commonly monitored |
|---|---|---|---|
| Labor availability | Missed delivery windows, longer dwell time, higher overtime | Stage inventory closer to demand to shorten routes and reduce stops per shift | Stops per route, on-time rate |
| Fuel price exposure | Higher cost per case on long, low-density runs | Rebalance facility-to-customer assignments to cut deadhead miles | Cost per mile, miles per stop |
| Inefficient routing | Excess miles, repeated backtracking, uneven driver workloads | Use multi-node fulfillment plans that fit daily order waves | Planned vs. actual miles, route variance |
| Limited visibility | Late exception calls, missed receiving windows, reactive rework | Integrate shipment status with inventory location to speed interventions | Exception response time, ETA accuracy |
Active management requires stop-level visibility. lineage logistics emphasizes real-time tracking and analytics. This data supports faster exception handling, clearer accountability, and tighter coordination across food distribution services and carriers.
End-to-End Modeling and Optimization for Frozen Food Logistics
Optimizing frozen food logistics requires models that accurately reflect real-world constraints. lineage logistics employs an engineering approach to assess facilities, transportation networks, inventory, demand patterns, and pallet movement within buildings. This method aids supply chain management teams in making informed decisions, balancing costs, service levels, and capacity.
Lineage boasts a team of over 50 specialists, utilizing a proven methodology validated through customer projects. Their work ensures that cold storage solutions align seamlessly with daily operations. This prevents disruptions at the dock door or within freezers.
Network modeling and design to identify the best distribution and storage footprint
Network modeling is essential for determining optimal distribution and storage layouts. The goal is to evaluate facility count, location, and flow paths objectively. This minimizes transportation and inventory costs while meeting service expectations. It helps define the ideal placement of cold storage solutions relative to production, ports, and demand centers.
| Model input | What is evaluated | Planning output used in operations |
|---|---|---|
| Facility locations and capacities | Slot availability, throughput limits, dock constraints, and freezer utilization | Recommended node count and placement to reduce overflow moves and rehandling |
| Customer and supplier demand patterns | Order frequency, seasonality, and regional demand density | Service-area mapping and inventory positioning rules |
| Transportation network and lanes | Transit times, lane costs, appointment windows, and carrier availability | Lane strategy that supports stable lead times and fewer expedited loads |
| In-building pallet movement | Travel distance, touches per pallet, staging space, and congestion points | Flow changes that reduce internal friction and protect throughput |
Inventory optimization to balance stock levels without tying up space or capital
Inventory optimization aims to match stock levels with demand without wasting space or capital. Inventory Forecasting methods predict market demand, guiding product placement to ensure business continuity. This is critical during seasonal peaks and surges, when cold storage solutions can tighten and misplacement raises handling and delay risk.
In frozen food logistics, models test reorder points, safety stock, and allocation rules against service targets and storage limits. For supply chain management leaders, the goal is disciplined inventory placement, avoiding broad buffering that consumes freezer capacity.
Transportation efficiency through smarter routing and loading patterns to cut miles
Transportation efficiency is achieved through smarter routing and loading patterns, designed to cut miles and reduce congestion. Transportation network optimization evaluates distribution center locations, modes, and packing solutions from production facilities to retail shelves. These levers help lineage logistics align route density, trailer utilization, and appointment schedules with the realities of temperature-controlled operations.
In practice, routing logic is paired with warehouse flow to ensure a better plan executes on the floor. This connection is critical in frozen food logistics, where delays at pickup can erase savings on paper.
Scenario and “what-if” modeling to test ideas before investing
Scenario and “what-if” modeling is a risk-managed way to evaluate redesigns before capital deployment or service disruption. Tests cover facility footprint, lanes, port choices, and inventory placement, using consistent assumptions across the network. For supply chain management teams, this creates a controlled way to compare options while protecting cold storage solutions from sudden capacity shocks.
By linking scenarios to operating constraints, lineage logistics frames decisions in measurable tradeoffs instead of broad estimates. This discipline supports planning cycles where speed matters, but errors are expensive in frozen food logistics.
Data, Visibility, and Decision Support Across the Cold Chain
In temperature-controlled logistics, small data gaps can cause significant service disruptions. Effective supply chain management relies on shared, accurate data, not assumptions. This is critical when products move through various stages, from ports to retail docks. Many teams turn to lineage logistics to align cold storage solutions with daily operations and measurable goals.
Using shipment history, demand patterns, and facility constraints to improve decisions
Quality decisions start with reliable data: shipment history, demand patterns, inventory levels, facility locations, and transportation costs. These data points often reside in different systems, making lineage logistics essential for data collection and standardization. This step is vital to reduce errors before analysis.
For a complete view, analyses include manufacturing and warehouse locations, ports, and supplier and retailer sites. This broader perspective allows teams to evaluate trade-offs between lead time, dwell time, and total cost in temperature-controlled logistics.
Models also reflect real-world facility constraints. Dock capacity, labor schedules, and pallet movement inside buildings are considered. This ensures cold storage solutions are feasible, not just theoretically efficient.
| Data element | Typical source mix | Decision supported | Cold chain impact |
|---|---|---|---|
| Shipment history | Customer TMS, Lineage records, carrier files | Lane baselines, variability, and cycle time targets | Fewer surprises during peak weeks in temperature-controlled logistics |
| Demand patterns | Customer planning systems, syndicated demand signals | Replenishment timing and safety stock sizing | Lower risk of stockouts that force costly expedites |
| Inventory data | WMS snapshots, ERP, scan events | Allocation rules and order fill sequencing | Reduced dwell time and better rotation in cold storage solutions |
| Facility locations | Customer network maps, Lineage network attributes | Network design and proximity to demand | Shorter average miles without sacrificing service windows |
| Transportation rates | Carrier contracts, broker quotes, market indices | Mode selection and cost-to-serve modeling | Clearer cost drivers in supply chain management decisions |
| Ports and manufacturing sites | Import/export documentation, supplier records | Inbound staging and deconsolidation planning | Less congestion risk at transfer points under capacity limits |
Real-time visibility into inventory and shipments to monitor performance post-change
After making changes, it’s essential to monitor performance. Lineage Link® offers real-time visibility into inventory and shipments. This supports ongoing monitoring and validation as volumes change by lane, customer, or facility.
This transparency aids in tighter cost control by identifying delays and avoiding unnecessary touches. In temperature-controlled logistics, every minute counts. Early warnings can reduce rework, detention costs, and exceptions due to missed appointment windows.
Reporting that supports timely interventions across ports, warehouses, and lanes
Effective decision support requires direct and operational reporting. Practical dashboards highlight congestion, late arrivals, aging inventory, and capacity constraints. This helps supply chain management teams act swiftly and consistently.
When exceptions occur, the goal is to quickly address them. What changed, where, and what action is possible today? Lineage logistics connects reporting to execution, ensuring cold storage solutions meet service-level commitments and cost goals.
Transportation and Storage Solutions That Reduce Miles Without Slowing Service
In U.S. cold chains, cost pressure often stems from distance, dwell time, and extra handling. The goal is to cut miles without slowing down service while keeping product integrity intact. lineage logistics focuses on two key questions: “How can we reduce miles without slowing service?” and “What are our biggest network inefficiencies, and how can we fix them?”
These solutions must align with the day-to-day operations of refrigerated warehousing. Ignoring dock capacity, appointment patterns, or freezer slot limits leads to congestion and lower on-time performance.
Lane strategy and facility location analysis
Facility location analysis helps determine the optimal number and placement of nodes to minimize costs. It evaluates service targets, lead times, and demand density, then compares network options against real lane rates and constraints.
Tighter lane strategies can also reduce variability. Consistent routing and loading patterns help cut miles and limit avoidable dwell. This supports steady throughput in refrigerated warehousing.
Nontraditional modes and LTL ride-sharing concepts
Using nontraditional transportation modes for select middle-mile moves can improve utilization. The aim is to increase fill, reduce cost per unit, and keep logistics within time windows.
Ride-sharing for LTL shipments is another effective tactic for fragmented volume. Pairing compatible freight and delivery windows raises trailer utilization without adding stops that risk frozen and chilled products.
Rethinking redistribution to improve flow
Rethinking redistribution is a direct savings lever. It reduces unnecessary handling and congestion across nodes. Staging inventory closer to demand and moving it through fewer handoffs supports reliable delivery and fewer schedule breaks.
For lineage logistics, redistribution redesign connects transportation decisions to warehouse performance. When inbound timing matches labor plans and slotting capacity, refrigerated warehousing can avoid bottlenecks that push freight into overflow and add extra touches.
| Network lever | Operational change | Cost pressure addressed | Service risk managed |
|---|---|---|---|
| Facility location analysis | Adjust node count and placement to shorten average length of haul | Lower linehaul and inventory holding by reducing safety stock distance | Protects delivery windows by aligning nodes to demand density |
| Lane strategy | Standardize routing and loading patterns with repeatable schedules | Reduces empty miles, detention, and rework from missed appointments | Improves on-time performance through predictable cutoffs |
| Nontraditional transportation modes | Shift select middle-mile moves to higher-utilization options | Improves cost per pallet moved when capacity is tight | Maintains transit-time control for temperature-controlled logistics |
| LTL ride-sharing | Combine partial loads with compatible temperature needs and windows | Raises utilization and reduces the number of underfilled moves | Limits extra stops that increase time out of the warehouse |
| Redistribution redesign | Stage inventory closer to demand and reduce handoffs | Cuts handling, congestion, and avoidable cross-dock labor | Reduces delay risk by moving through fewer nodes |
Case Study Snapshot: Solving Capacity Issues and Supply Chain Bottlenecks
A U.S. importer turned to lineage logistics to tackle capacity issues and supply chain bottlenecks. They aimed to enhance network efficiency across their temperature-controlled footprint. The goal was to scale up while maintaining service quality for food distribution services.
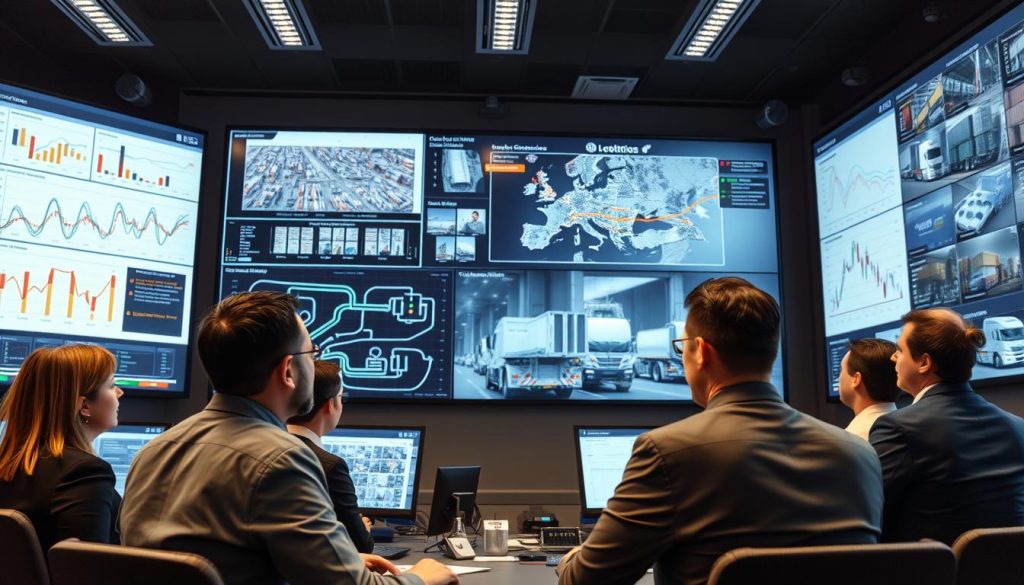
The project focused on managing supply chain tradeoffs in the cold chain. This included port selection, inland capacity, and inventory positioning. It also explored how to increase throughput without unnecessary handling steps in cold storage solutions.
How Northeast capacity constraints can create bottlenecks at critical nodes
In the Northeast, capacity constraints led to bottlenecks at key points. These included port drayage, warehouse appointment windows, and tight delivery slots. Such constraints slowed operations and threatened growth plans as volumes increased.
When cold rooms and yard space are nearly full, small disruptions can have a big impact. For food distribution services, this can lead to longer dwell times and less flexible replenishment cycles.
What the analysis included: shipments, supplier/retailer locations, rates, ports, and warehouses
The analysis involved a detailed input set to map lanes, costs, and capacity. It combined operational records with network constraints. This supported planning under realistic throughput limits in cold storage solutions.
- Historical shipment data
- Supplier and retailer locations
- Transportation rates
- Manufacturing locations
- Warehouse locations
- Ports of entry or departure
| Analysis input | Operational question it supports | Planning value for supply chain management |
|---|---|---|
| Historical shipment data | Where do lead times, dwell, and variability concentrate by lane and week? | Anchors baseline performance and isolates recurring bottleneck patterns |
| Supplier and retailer locations | Which origin-destination pairs drive the highest volume and service sensitivity? | Improves lane design and supports stable replenishment for food distribution services |
| Transportation rates | What is the cost impact of mode changes, longer hauls, or port shifts? | Quantifies tradeoffs between cost, capacity access, and service targets |
| Manufacturing locations | How should freight flow from production into ports, storage, and outbound lanes? | Aligns upstream output with downstream cold storage solutions capacity |
| Warehouse locations | Which nodes are over-allocated, and where does slack capacity exist? | Supports inventory deployment decisions and reduces congestion risk |
| Ports of entry or departure | How do port options change dray miles, dwell time, and inland capacity access? | Builds resilient routing choices under Northeast capacity constraints |
Outcome example: identifying distribution center expansion and ports to place inventory closer to demand
The analysis helped identify the right distribution centers for inventory deployment. It also pinpointed freight lanes for efficiency from production to retail shelves. The plan included new ports and distribution center locations to place inventory closer to demand.
Within the lineage logistics model, these recommendations built a scalable network. The focus was on controllable levers like node placement, lane geometry, and capacity alignment. This allowed the importer to expand without facing supply chain bottlenecks.
Measurable Results: Cost Savings, Service Improvements, and Sustainability Gains
Managing cold chain networks is straightforward when results are tied to specific actions, not just slogans. In frozen food logistics, the biggest gains often come from adjusting the facility size, improving execution, and measuring service against clear benchmarks. For temperature-controlled logistics, it’s about tracking miles, dwell time, touches, and on-time delivery in the same scorecard used for cost.
Example result: $2 million in annual transportation cost savings through network changes
Lineage found that expanding to four distribution centers and entering new markets could save an importer $2 million annually. This redesign also supported better delivery service levels and reduced bottlenecks caused by limited nodes. The savings come from cold chain economics: a new port and discharge strategy can cut linehaul distance, improve lane balance, and lower delay costs.
These changes also lead to tighter transportation and storage solutions by reducing variability in appointment windows and dock schedules. With fewer high-friction nodes, carriers spend less time waiting, and planners get more reliable cycle times for replenishment. This reliability is key in refrigerated warehousing, where labor planning and slotting depend on predictable flow.
How fewer handling events can reduce spoilage and waste in food distribution
Handling touches in the cold chain act like hidden interest: each extra move increases risk and adds time out of an ideal temperature band. Redistribution redesign and middle-mile coordination can reduce transfers, re-stacks, and short-notice cross-docks. Fewer touches generally mean less damage, lower spoilage exposure, and less waste across food distribution.
For temperature-controlled logistics, the operational benefit is measurable in shrink, claims, and rework labor. It also supports sustainability-linked reporting, as waste reduction improves the efficiency of energy, packaging, and transport per delivered case. In frozen food logistics, those improvements tend to be most visible where product is handled across multiple nodes or mixed-temperature zones.
Utilization improvements that show up quickly: fewer bottlenecks and smoother warehouse flow
Utilization gains often surface early, mainly when congestion points are addressed with better placement, slotting discipline, and appointment management. Smoother warehouse flow reduces internal backups that can delay staging and load-out. In refrigerated warehousing, this can translate into faster turns, steadier labor utilization, and fewer knock-on delays to outbound routes.
Results depend on both analytics and execution. Modeling can identify the best network shape, but ongoing performance requires operating the network as designed, with consistent processes and clear accountability. This combination helps stabilize service while keeping transportation and storage solutions aligned with real-world constraints in temperature-controlled logistics.
| Measurement area | Primary operational lever | What changes in practice | Where it shows up first |
|---|---|---|---|
| Transportation cost per case | Facility footprint and port/discharge strategy | Shorter linehaul distance, better lane efficiency, fewer congestion-driven delays | Freight spend trends, carrier dwell time, on-time pickup |
| Product quality and waste | Fewer handling events through redesigned redistribution | Less re-stacking and transfer exposure, tighter temperature discipline | Shrink rates, claims, spoilage-related disposals |
| Warehouse throughput | Flow and placement improvements inside the building | Reduced internal backups, steadier staging and dock work | Door utilization, order cycle time, labor productivity |
| Service levels | Execution against the modeled network | More consistent appointment performance and inventory availability | OTIF performance, backorders, customer escalations |
Conclusion
U.S. cold chain operations face increasing costs and service demands, with the last mile being a major contributor. In food distribution, last-mile delivery can account for 40% of total costs. Yet, the most significant savings can be found upstream, where the middle mile can be optimized through better coordination and smarter mode selection.
Effective supply chain management requires an integrated approach, not piecemeal solutions. It involves linking facility footprint, inventory planning, transportation, warehouse flow, and ports strategy. Scenario testing is then used to validate trade-offs before implementing changes.
lineage logistics is well-equipped to support both design and execution at scale. The company boasts 420+ temperature-controlled warehouses and real-time visibility through Lineage Link®. It also has 50+ experts in modeling, optimization, and data science. These capabilities enhance cold storage solutions by aligning data, capacity, and operational discipline.
The key to success in food distribution services lies in measurable outcomes. This includes fewer miles, reduced bottlenecks, and lower spoilage risk. Savings should be quantifiable, such as $2 million annually from network changes. This approach makes supply chain management a continuous process, not a one-time endeavor.
FAQ
How does Lineage Logistics evaluate cold chain performance in the United States?
Lineage Logistics assesses cold chain performance by examining the entire chain. This includes refrigerated storage, transportation, inventory placement, and in-building flow. They consider facilities, demand patterns, labor, ports, automation, and warehouse execution as interconnected. This approach ensures network design decisions are effective in real-world operations.
Why does cold chain complexity keep rising for U.S. shippers?
The complexity of U.S. cold chains grows with e-commerce expansion. This increase demands more last mile services, diversifies product offerings, and fragments orders. Such changes elevate service expectations and boost the number of decisions needed across storage, transportation, and inventory.
Why is the last mile such a large cost factor in refrigerated distribution?
The last mile, the final leg of transportation, accounts for about 40% of cold chain logistics costs in food service. Expenses like labor, fuel, inefficient routes, delays, and lack of transparency inflate costs. Despite limited control over delivery conditions, these factors significantly impact spend.
What is the “middle mile,” and why can it unlock savings before delivery?
The middle mile refers to the movement of products between suppliers and warehouses. Lineage sees it as a key area for improvement. Better scheduling, mode selection, and lane design can reduce delays and inefficiencies. This, in turn, minimizes disruption in the last mile and lowers overall costs.
What types of changes can improve utilization without a full network overhaul?
Lineage suggests several incremental changes with significant impacts. These include using nontraditional transportation modes and ride-sharing for LTL shipments to enhance trailer utilization. Rethinking redistribution can also reduce unnecessary moves. These strategies are tested against facility constraints and lane economics to avoid congestion.
How does Lineage connect cold storage solutions to transportation, inventory, and port strategy?
Lineage links cold storage solutions to demand and lane design by analyzing facility footprint and inventory placement. This affects miles, loading patterns, congestion, and dock schedules. For import flows, the analysis considers ports of entry or departure and discharge. This positions inventory closer to demand while managing capacity constraints.
What proof points support Lineage’s ability to design and run temperature-controlled networks?
Lineage operates over 420 temperature-controlled warehouses, supporting flexible configurations from small parcels to full truckloads. It has a team of over 50 supply chain engineers in modeling, optimization, and data science. The company supports execution after network design, not just modeling.
What data is used for network modeling, inventory optimization, and routing decisions?
Data includes shipment history, demand patterns, inventory data, facility locations, and transportation rates. This comes from customer systems, Lineage systems, and third-party data. For importer and food distribution services, analyses also consider manufacturing and warehouse locations, and ports of entry or departure.
How does visibility help control cost and service performance after changes are implemented?
Increased transparency aids in faster exception management, reducing delay-driven costs. Lineage uses Lineage Link® for real-time visibility into inventory and shipments. This enables monitoring across ports, warehouses, and lanes, validating and correcting performance as conditions change.
What does Lineage’s optimization scope include for frozen food logistics?
Lineage’s scope includes network design, inventory optimization, and transportation efficiency. It focuses on smarter routing and loading patterns to cut miles and reduce congestion. Scenario and “what-if” modeling test facility footprint, lane changes, and port strategies before investment or service risk.
How do fewer handling events reduce spoilage risk and waste in cold chain operations?
Delays and extra handling increase damage and spoilage risks, leading to waste and eroding service levels. Lineage aims to reduce “touches” through redistribution redesign and supplier-to-warehouse coordination. This supports quality control, lowers loss, and improves sustainability-linked cost performance in refrigerated warehousing.
Is there an example of quantified savings from Lineage’s network changes?
An analysis for a U.S. importer facing Northeast capacity constraints evaluated historical shipment data and locations. It considered transportation rates, manufacturing, warehouse locations, and ports. The outcome suggested expanding into four distribution centers and adjusting port strategy, with estimated million in annual transportation cost savings and improved service levels.